
Highlights
- Silver prices slipped below the 51-day SMA during Thursday’s trading session.
- RSI indicators remained below neutral levels, reflecting weaker short-term momentum in silver prices.
- Trading activity showed continued price volatility as silver failed to sustain recent gains.
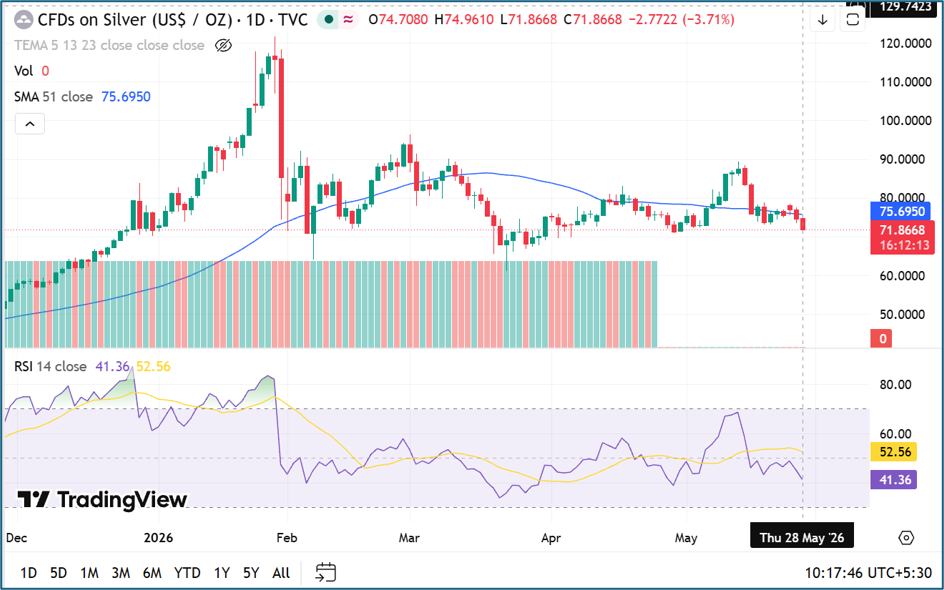
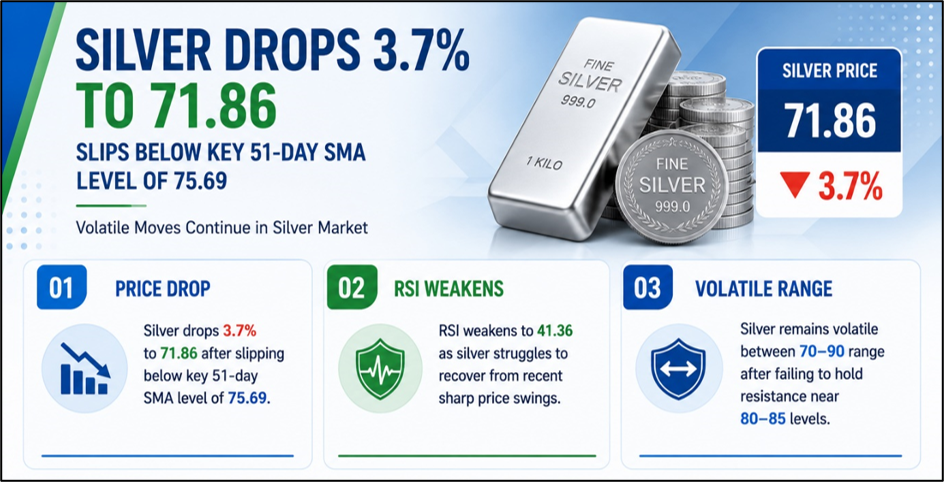
CFDs on Silver (US$/OZ) traded lower on May 28, 2026, as technical indicators pointed toward weakening momentum in the precious metals market. The daily chart showed silver prices closing near 71.86 after touching intraday highs around 74.96 and lows near 71.86 during the session.
The decline pushed silver below its 51-day simple moving average (SMA), which stood around 75.69 on the chart. Market participants continued monitoring technical indicators for signs of further weakness or possible consolidation after recent price swings.
Source: Trading View
Silver Trades Below 51-Day SMA
The chart indicated that silver prices moved under the 51-day SMA, often viewed by traders as a medium-term trend indicator. Price action below this level may reflect weaker market sentiment in the short term.
During the session, silver recorded a daily decline of approximately 3.71%, reflecting selling pressure across the commodity. The candlestick structure also showed that prices erased gains from previous sessions and approached support levels seen earlier in April.
Technical traders frequently monitor moving averages to identify directional momentum. A sustained move below the average may increase focus on lower support zones, while recovery above the level could indicate renewed buying interest.
RSI Signals Momentum Weakness
The Relative Strength Index (RSI) on the daily chart stood near 41.36, remaining below the neutral 50 level. RSI readings below 50 are commonly interpreted as weaker momentum conditions.
The RSI moving average line was near 52.56, remaining above the main RSI reading. This divergence suggested that momentum had slowed compared with earlier sessions in May when silver prices attempted a rebound toward the mid-80 range.
Lower RSI readings may also indicate that traders are becoming cautious following recent volatility in the metals market. However, RSI levels above 30 generally suggest that prices have not yet entered oversold territory.
Source: Analysis by Kalkine
Volatility Continues Across Precious Metals
Silver prices have experienced wide swings over recent months, according to the chart structure. Earlier in 2026, silver rallied above the 110 mark before witnessing a sharp correction. Prices later stabilized within a broader range between 70 and 90.
The latest decline added to signs of consolidation across the precious metals segment. Broader commodity market sentiment, inflation expectations, central bank policy signals, and currency fluctuations often influence silver trading patterns.
The chart also showed multiple short-term rebounds failing near resistance zones around the 80–85 range. This pattern may remain under observation in upcoming sessions.
Market Participants Monitor Support Levels
Technical traders may continue watching whether silver holds above recent support zones around the low-70 levels. Any sustained weakness below these ranges could attract further market attention.
At the same time, recovery above the SMA indicator may shift sentiment toward stabilization. Volume patterns and momentum indicators are also likely to remain important in evaluating near-term direction.
Silver remains widely tracked due to its dual role as both an industrial and precious metal commodity. As a result, market movement may continue reacting to broader macroeconomic developments and industrial demand trends.
Key Risks Investors Should Track
- Silver price volatility may increase due to changing global economic conditions.
- Currency fluctuations can affect precious metal pricing and trading sentiment.
- Weak industrial demand could influence silver consumption trends globally.
- Rising interest rates may reduce investor interest in non-yielding assets.
Summary
CFDs on Silver (US$/OZ) traded lower on May 28, 2026, falling below the 51-day SMA while RSI indicators reflected weaker momentum conditions. The daily chart highlighted continued volatility, with silver remaining within a broad trading range after earlier sharp price swings in 2026. Market participants may continue monitoring support levels, technical indicators, and broader macroeconomic developments influencing precious metal prices.
FAQs
Q: Why did silver prices decline on May 28, 2026?
A: Silver prices declined amid weaker momentum indicators and trading below the 51-day moving average on the daily chart.
Q: What does the RSI level near 41 indicate for silver?
A: An RSI near 41 suggests weakening momentum, though prices have not yet entered oversold trading territory.
Q: Why is the 51-day SMA important in silver trading?
A: The 51-day SMA helps traders identify medium-term price trends and potential market direction changes.