
Highlights
- Vodafone Idea shares gained more than 6% during Wednesday NSE trading session.
- The stock touched a fresh 52-week high of INR 12.84 intraday.
- Trading value crossed INR 1,146 crore amid heavy investor participation levels.
Shares of Vodafone Idea Limited (NSE:IDEA) advanced sharply during the May 13, 2026 trading session, rising 5.89% to INR 12.59 on the National Stock Exchange.
The stock opened at INR 12.18 and touched an intraday high of INR 12.84, which also marked its fresh 52-week high. The session low stood at INR 12.04. The previous closing price was INR 11.89. Investor participation remained elevated throughout the session as telecom sector counters witnessed active trading activity.
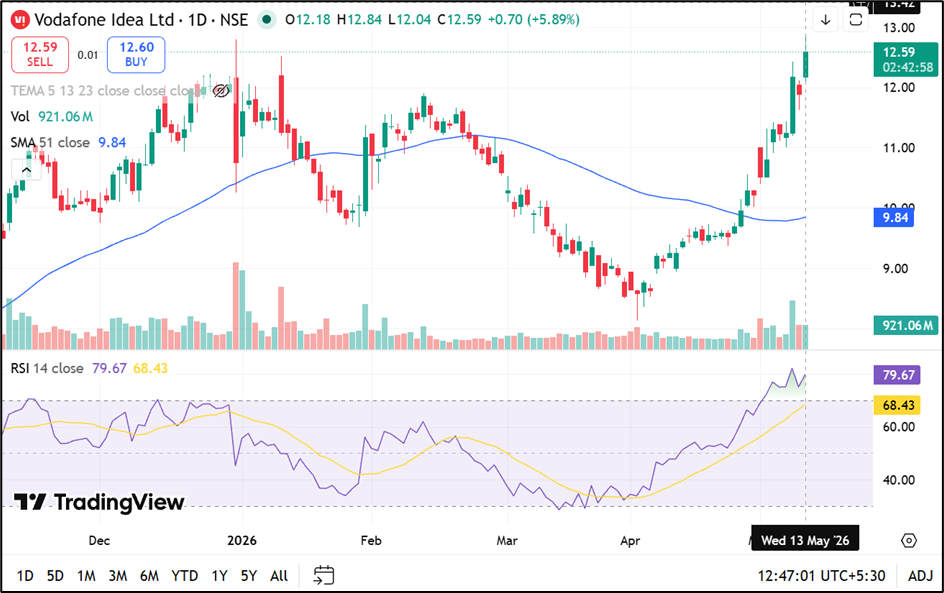
Source: TradingView
Trading Turnover Crosses INR 1,100 Crore
Vodafone Idea recorded traded volume of 9,226.20 lakh shares during the trading session. Traded value stood at approximately INR 1,146.82 crore, while the stock reported a VWAP of INR 12.43.
Deliverable quantity as a percentage of traded quantity stood at 30.18%, indicating delivery-based participation in the stock. The stock’s impact cost stood at 0.06 during the session.
Stock Outperforms Benchmark Returns
Vodafone Idea shares recorded gains across multiple time periods. The stock advanced 11.42% over the previous one week and gained 36.11% during the last one month.On a year-to-date basis, the stock rose 8.53%, while one-year returns stood at 81.41%.
The stock delivered returns of 79.86% over a three-year period and 43.07% over five years. During the same one-year period, the NIFTY 200 index declined 0.64%.
Market Capitalisation and Volatility Metrics
The company’s total market capitalisation stood at approximately INR 1,36,620.57 crore, while free float market capitalisation was around INR 34,690.62 crore. Daily volatility stood at 3.32 and annualised volatility was recorded at 63.43. The stock’s 52-week low stood at INR 6.12 recorded on August 14, 2025.
Telecom Business Operations
Vodafone Idea Limited operates in the telecommunications sector and provides mobility and long-distance services across India. The company is also engaged in trading handsets and data cards.
The stock exchange disclosure indicated that the company has remained loss-making during the last eight quarters, while EPS based on the previous four trailing quarters remained at zero.
Source: Company Filing
Key Risks
- High competition may impact telecom market share and pricing trends.
- Regulatory changes could affect telecom sector operating environment.
- Elevated debt levels may influence financial flexibility and funding costs.
- Network expansion costs may impact profitability and cash flow metrics.
Summary
Vodafone Idea Limited (NSE:IDEA) shares gained over 6% during the May 13, 2026 NSE trading session and touched a fresh 52-week high of INR 12.84. The stock recorded traded value above INR 1,146 crore amid heavy investor participation.
Vodafone Idea operates in mobility and long-distance telecom services and has delivered strong one-year and three-year return performance despite continued loss-making indicators.
FAQs
Q: Why did Vodafone Idea shares rise on May 13, 2026?
A: The stock gained amid heavy trading activity and touched a fresh 52-week high during the session.
Q: What was Vodafone Idea’s intraday high during trading?
A: Vodafone Idea touched an intraday and 52-week high of INR 12.84 on NSE.
Q: What services does Vodafone Idea provide?
A: Vodafone Idea provides mobility, long-distance telecom services, handsets and data card offerings.