
Highlights
- Rain Industries shares surged more than 12 percent during Monday’s trading session.
- Investors tracked quarterly revenue growth and higher adjusted EBITDA figures.
- The stock witnessed heavy trading volumes and remained among top market gainers.
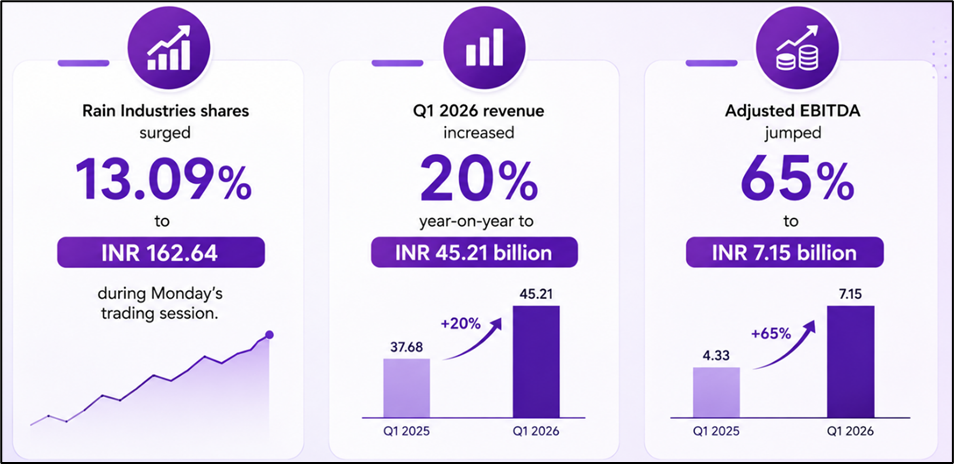
Shares of Rain Industries Limited (NSE:RAIN) witnessed strong buying interest during Monday’s trading session on the NSE. The stock traded at INR 162.64 on May 11, 2026, up 13.09 percent from the previous close of INR 143.82.
The stock opened at INR 154.80 and touched an intraday high of INR 164.89, while the day’s low stood at INR 153.20. Trading activity remained elevated with volumes of around 457.95 lakh shares and traded value of nearly INR 738.13 crore.
Rain Industries shares traded close to their 52-week high of INR 176.00 recorded on February 10, 2026. The stock’s 52-week low stood at INR 99.90.
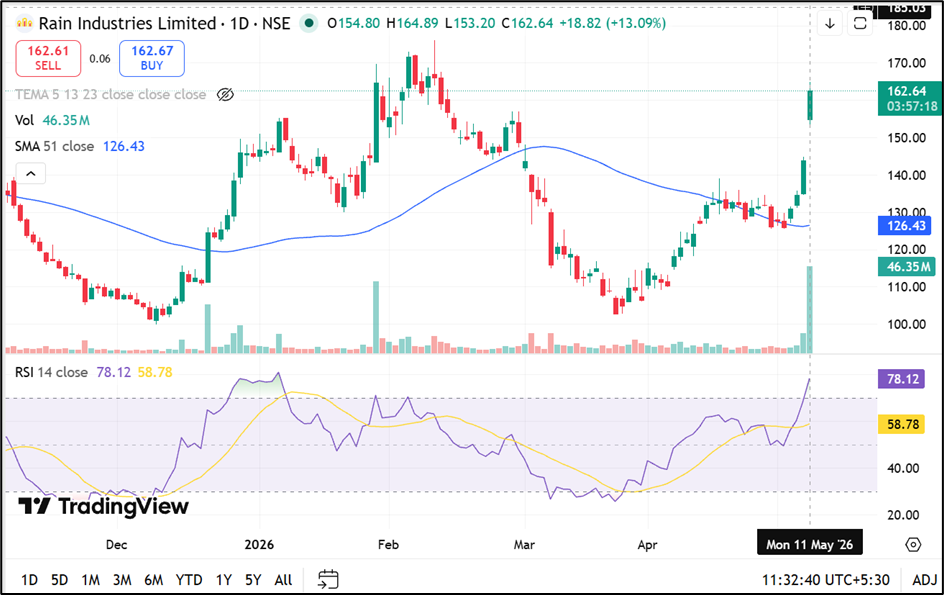
Source: TradingView
Segment Performance Remains In Focus
Rain Industries Limited operates across carbon, advanced materials, and cement businesses.
The carbon segment reported higher revenue and EBITDA, supported by volume improvement in calcination and higher product pricing. The advanced materials business recorded higher volumes in chemical intermediates and resins subsegments.
The cement business reported lower revenue and EBITDA due to lower volumes and increased operating costs.
Commodity Trends And Market Factors
The company highlighted that aluminium production disruptions in the Middle East may impact supply conditions, while commodity prices including Brent oil, fuel oil, naphtha, and natural gas remained elevated during recent quarters.
Rain Industries reported net debt of USD 825 million at the end of March 2026, compared with USD 837 million in December 2025. Net debt to EBITDA ratio stood at 2.85.
Quarterly Revenue And EBITDA Increase
Rain Industries reported revenue from operations of INR 45.21 billion for Q1 2026, reflecting a 20 percent increase compared with the corresponding quarter last year. Adjusted EBITDA stood at INR 7.15 billion, up 65 percent year-on-year.
Adjusted net profit after tax for the quarter came in at INR 1.25 billion, while adjusted earnings per share stood at INR 3.70. The company reported capital expenditure of USD 10 million during the quarter.
Liquidity stood at USD 362 million, including cash balance of USD 163 million and undrawn loan facilities of USD 199 million. The company also stated that there are no major term debt maturities until October 2028.
Risks For Investors
- Commodity price volatility may impact operating margins.
- Higher debt levels could affect financial flexibility.
- Global industrial slowdown may impact product demand.
- Cement business competition may pressure profitability.
Summary
Rain Industries (NSE:RAIN) shares surged 13 percent on May 11, 2026, amid heavy trading activity and investor focus on quarterly financial performance. The company reported higher revenue and adjusted EBITDA growth across its carbon and advanced materials businesses. Market participants also tracked commodity price trends, debt levels, and developments across industrial and materials sectors during the session.
FAQs
Q: Why did Rain Industries shares rise on May 11, 2026?
A: Rain Industries shares gained after investors tracked revenue growth and higher adjusted EBITDA performance.
Q: What businesses does Rain Industries operate in?
A: Rain Industries operates across carbon, advanced materials, and cement business segments globally.
Q: What was Rain Industries’ Q1 2026 adjusted EBITDA?
A: Rain Industries reported adjusted EBITDA of INR 7.15 billion for Q1 2026.