
Highlights
- Abbott India shares advanced 1.02% during NSE intraday trading on May 15.
- The stock touched an intraday high of ₹ 28,100 during the session.
- Abbott India remained below its 52-week high despite recent gains.
Shares of Abbott India Limited (NSE:ABBOTINDIA) traded higher during intraday trading activity on May 15, 2026. The stock gained 0.98% on the National Stock Exchange and was quoted at ₹ 27,790.00, compared with the previous close of ₹ 27,520.00.
The stock opened at ₹ 27,700.00 and traded between an intraday low of ₹ 27,505.00 and a high of ₹ 28,100.00. Volume-weighted average price stood at ₹ 27,822.92 during the session.
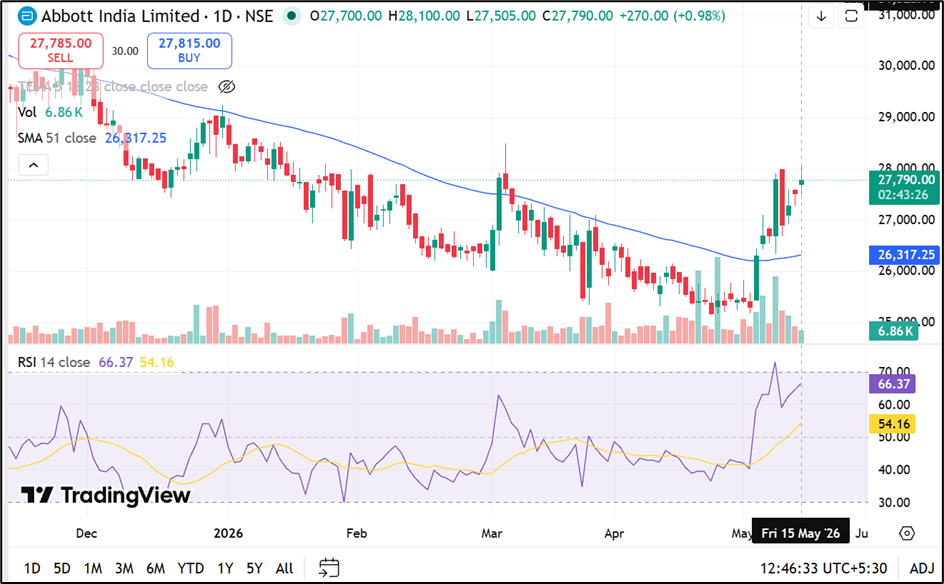
Source: Trading View
Trading Activity and Market Capitalisation
Abbott India recorded traded volume of 0.07 lakh shares during the trading session, while traded value stood at ₹ 18.91 crore.
The company’s total market capitalisation was reported at ₹ 59,062.43 crore, while free float market capitalisation stood at ₹ 14,434.98 crore. Deliverable quantity accounted for 63.96% of traded quantity, while impact cost remained at 0.06.
Stock Performance Compared With Benchmark Index
Abbott India outperformed the NIFTY MNC index across short-term periods despite remaining negative on a one-year basis. Over the past week, the stock gained 4.10%, compared with a 1.75% decline in the benchmark index. On a one-month basis, Abbott India advanced 7.01%, while the NIFTY MNC index rose 4.14%.
Year-to-date returns stood at negative 2.42% for the stock, while the benchmark index gained 3.91%. Over the past one year, Abbott India declined 8.36%, compared with a 14.07% rise in the benchmark index. The stock generated returns of 30.94% over three years and 72.53% over five years.
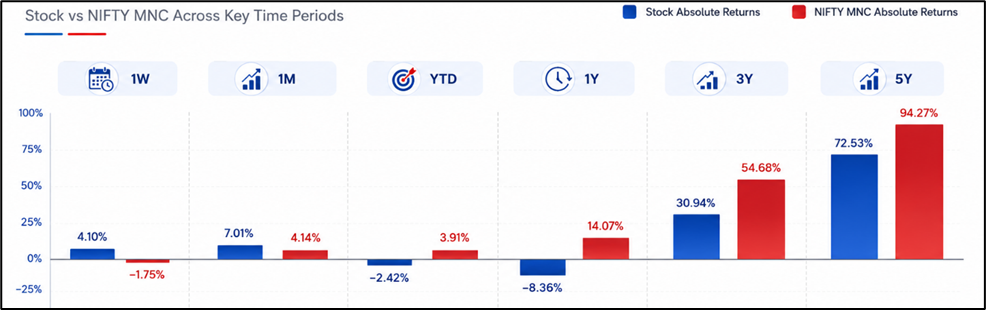
Source: NSE
52-Week Range and Volatility Metrics
Abbott India touched its 52-week high of ₹ 37,000.00 on June 27, 2025, while the 52-week low of ₹ 25,150.00 was recorded on April 24, 2026.Daily volatility stood at 1.43, while annualised volatility was reported at 27.32. The stock traded within a 20% price band and had a tick size of ₹ 5.00.
Company Overview
Abbott India Limited is one of the multinational pharmaceutical companies operating in India. The company primarily sells its pharmaceutical products through independent distributors within the Indian market.
The company was established in 1944 and continues to operate across pharmaceutical product segments in India.
Key Risks
- Regulatory pricing controls may impact pharmaceutical product profitability.
- Currency fluctuations could influence imported raw material costs.
- Competition in branded generic medicines may affect market positioning.
- Supply chain disruptions may impact product distribution and availability.
Summary
Abbott India (NSE:ABBOTINDIA) shares traded higher on May 15, 2026, with the stock gaining 1.02% during intraday NSE trading. The stock remained below its 52-week high despite recent gains in short-term performance. Abbott India continued to reflect mixed long-term returns while operating as a multinational pharmaceutical company focused primarily on the Indian market through distributor-led product sales.
FAQs
Q: What was Abbott India share price on May 15, 2026?
A: Abbott India traded at ₹ 27,800 during intraday trading on the NSE.
Q: What is the 52-week high and low of ABBOTIND stock?
A: The stock recorded a 52-week high of ₹ 37,000 and low of ₹ 25,150.
Q: What business does Abbott India Limited operate in?
A: Abbott India operates in pharmaceutical products distribution and sales across the Indian market.