
Highlights
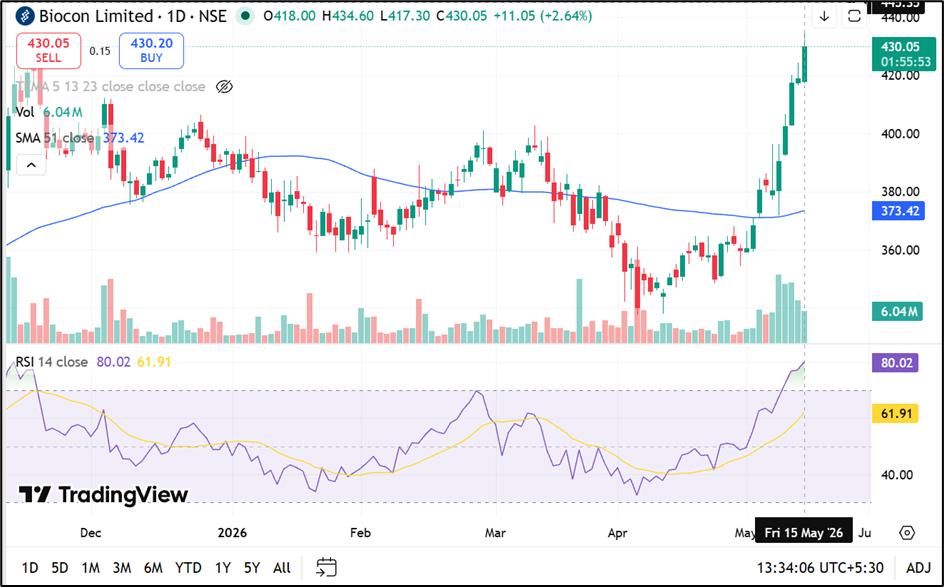
- Biocon shares gained 2.64% during intraday trading on May 15, 2026.
- The stock touched a 52-week high of INR 434.60 during the session.
- Biocon outperformed the NIFTY Pharma index in short-term returns.
Shares of Biocon Limited (NSE:BIOCON) traded higher on May 15, 2026, rising 2.64% during intraday activity on the National Stock Exchange. The stock was quoted at INR 430.05 as of 13:32 PM IST compared with the previous close of INR 419.00.
The stock opened at INR 418.00 and moved between an intraday low of INR 417.30 and a high of INR 434.60, which also marked its 52-week high level. The volume-weighted average price stood at INR 427.92.
Source: Trading View
Trading Activity and Market Capitalisation
Biocon recorded traded volume of 60.13 lakh shares and traded value of INR 257.31 crore during the session, reflecting active participation.The company’s total market capitalisation stood at INR 69,707.14 crore, while free float market capitalisation was INR 30,613.71 crore.
Impact cost remained at 0.03, indicating relatively stable execution levels during trading.Deliverable quantity stood at 41.35% of total traded volume, while applicable margin rate was 15.57%.
Performance Versus Pharma Benchmark Index
Biocon outperformed the NIFTY Pharma index across multiple timeframes. Over the past week, the stock gained 13.05%, compared with 2.26% for the index. On a one-month basis, Biocon rose 22.75%, significantly higher than the 9.90% index return.
Year-to-date returns stood at 10.91% for Biocon, compared with 8.94% for the benchmark. The stock gained 27.01% over the past one year. Three-year returns stood at 73.44%, while five-year returns were reported at 10.61%.
52-Week Range and Volatility Profile
Biocon touched its 52-week high of INR 434.60 on May 15, 2026, while the 52-week low was INR 327.60 recorded on June 6, 2025. The stock reported daily volatility of 1.90 and annualised volatility of 36.30. The price band was listed as no band, and tick size stood at INR 0.05.
Business Overview
Biocon Limited is engaged in the manufacture of biotechnology products and research services. The company operates in biologics, biosimilars, and research services, focusing on development and manufacturing of biopharmaceutical solutions across global markets.
Source: Company Filing
Key Risks
- Regulatory approvals may impact product launch timelines in global markets.
- Competition in biosimilars segment may pressure pricing and margins.
- Currency fluctuations may affect export-linked revenue streams.
- R&D dependency may impact profitability due to high development costs.
Summary
Biocon (NSE:BIOCON) shares rose 2.64% on May 15, 2026, and touched their 52-week high during intraday trading. The stock outperformed the broader NIFTY Pharma index across short-term and medium-term periods. Strong trading volumes and sustained investor participation were observed during the session. The company continues to operate in biotechnology and research services with exposure to global pharmaceutical markets, while maintaining volatility in line with sector dynamics.
FAQs
Q: What was Biocon share price on May 15, 2026?
A: Biocon traded at INR 430.05 during intraday NSE trading activity.
Q: What is Biocon’s 52-week high and low?
A: The stock recorded a 52-week high of INR 434.60 and a low of INR 327.60.
Q: Which sector does Biocon operate in?
A: Biocon operates in biotechnology products and pharmaceutical research services.