
Highlights
- Aurobindo Pharma touched a fresh 52-week high of INR 1,565.00 during Thursday's trading session.
- The stock closed 1.61% higher at INR 1,555.20 while outperforming the NIFTY MIDCAP 50 across most periods.
- The company reported consolidated net profit of INR 92,084 lakh for the quarter ended March 2026.
Aurobindo Pharma Limited (NSE:AUROPHARMA) remained in focus on June 25, 2026, after its shares climbed to a fresh 52-week high during the trading session before ending with gains. The stock reached an intraday high of INR 1,565.00, marking its highest level over the past year, and closed at INR 1,555.20 on the National Stock Exchange (NSE). The closing price represented an increase of 1.61% from the previous close of INR 1,530.60.
The stock opened at INR 1,536.00 and traded within an intraday range of INR 1,532.00 to INR 1,565.00. The volume-weighted average price (VWAP) stood at INR 1,554.39. During the session, approximately 20.99 lakh shares changed hands, resulting in a traded value of around INR 326.26 crore.
Stock Outperforms Benchmark Across Most Timeframes
Aurobindo Pharma continued to outperform the NIFTY MIDCAP 50 across several investment periods. The stock gained 3.79% over one week, while the benchmark declined 0.83%. Over one month, the share advanced 6.39%, compared with a decline of 0.86% in the index.
On a year-to-date basis, the stock rose 30.31%, significantly ahead of the benchmark's gain of 1.41%. The one-year return stood at 38.41%, while the NIFTY MIDCAP 50 gained 5.03%. Over three years, the stock generated a return of 115.51%, exceeding the benchmark's 77.95%. However, over the five-year period, the stock returned 63.58%, compared with 135.22% for the benchmark.
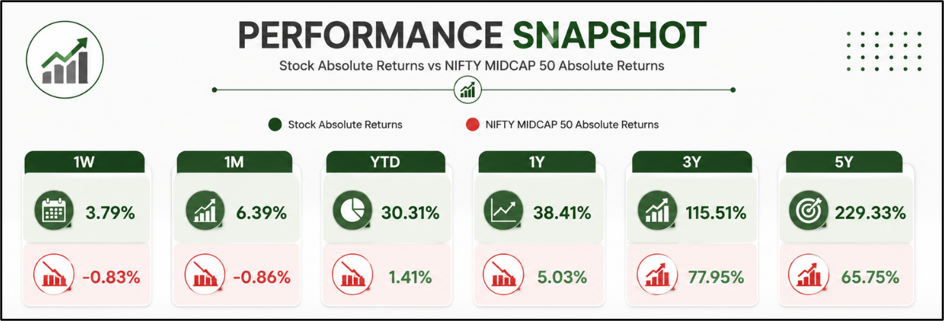
Source: NSE
Market Capitalisation and Trading Activity
Aurobindo Pharma ended the trading session with a total market capitalisation of INR 89,448.25 crore, while its free-float market capitalisation stood at INR 42,930.06 crore.
The stock recorded an impact cost of 0.02%, indicating active market participation. Deliverable quantity accounted for 59.83% of the traded volume. The company has a face value of INR 1 per share, while the applicable margin rate stood at 14.54%.
The stock is part of the NIFTY MIDCAP 50 Index and operates under the Pharmaceuticals industry classification.
Valuation and Price Movement
Aurobindo Pharma traded at a symbol price-to-earnings (P/E) ratio of 25.56, while the adjusted P/E stood at 25.22.
During the past 52 weeks, the stock traded between a low of INR 1,016.10 and a fresh high of INR 1,565.00. Daily volatility stood at 1.75%, while annualised volatility was reported at 33.43%. The security remained in active trading status and continued to trade without any price band restrictions.
March 2026 Financial Performance
For the quarter ended March 31, 2026, Aurobindo Pharma reported unaudited consolidated total income of INR 8,97,038 lakh. Consolidated profit before tax stood at INR 1,29,304 lakh, while consolidated net profit came in at INR 92,084 lakh. Consolidated earnings per share (EPS) for the quarter was INR 15.86.
On a standalone basis, the company reported total income of INR 3,00,064 lakh. Standalone profit before tax stood at INR 87,631 lakh, while net profit reached INR 69,223 lakh. Standalone earnings per share for the quarter was INR 11.92.
Key Risks
- Regulatory actions may affect pharmaceutical operations.
- Currency fluctuations could influence export earnings.
- Pricing pressure may impact future profitability.
- Market volatility can affect short-term share performance.
Performance
Aurobindo Pharma shares closed at INR 1,555.20 on Thursday, up 1.61% from the previous close of INR 1,530.60 after touching a fresh 52-week high of INR 1,565.00. The stock traded between INR 1,532.00 and INR 1,565.00, with 20.99 lakh shares changing hands and a traded value of INR 326.26 crore. The stock outperformed the NIFTY MIDCAP 50 across one-week, one-month, year-to-date, one-year and three-year periods.
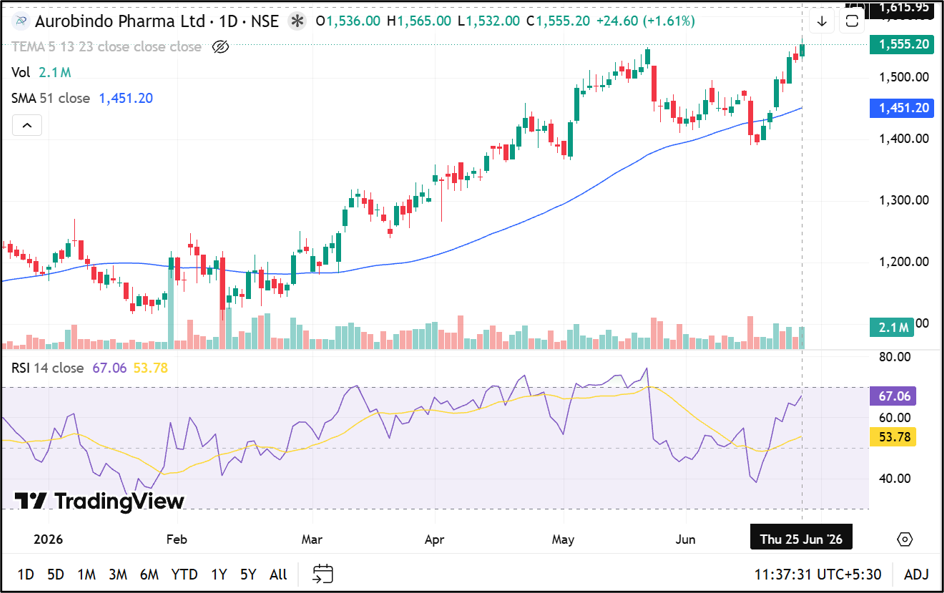
Source: TradingView
Summary
Aurobindo Pharma (NSE:AUROPHARMA) ended Thursday's session with gains after reaching a fresh 52-week high during intraday trade. The company reported consolidated net profit of INR 92,084 lakh for the March 2026 quarter while maintaining a market capitalisation of nearly INR 89,448 crore. The stock continued to outperform the NIFTY MIDCAP 50 across most investment horizons.
FAQs
Q: Why was Aurobindo Pharma stock in focus today?
A: The stock touched a fresh 52-week high of INR 1,565.00 before closing 1.61% higher at INR 1,555.20.
Q: What were Aurobindo Pharma's March 2026 consolidated financial results?
A: The company reported consolidated total income of INR 8,97,038 lakh and consolidated net profit of INR 92,084 lakh.
Q: How has Aurobindo Pharma performed compared with the NIFTY MIDCAP 50?
A: The stock outperformed the benchmark across one-week, one-month, year-to-date, one-year and three-year return periods.