
Highlights
- Natco Pharma stock rose 3.34%, nearing its 52-week high level.
- The stock delivered 40.12% returns over one year, outperforming benchmark indices.
- Trading volumes remained active with strong liquidity indicators during the session.
Shares of Natco Pharma Limited (NSE:NATCOPHARM) were trading at ₹1,162.30 on May 6, 2026, up 3.32% from the previous close of ₹1,125.00. The stock opened at ₹1,137.00 and touched an intraday high of ₹1,169.70, which also marks its 52-week high. The day’s low stood at ₹1,129.30, indicating sustained upward movement during the session.
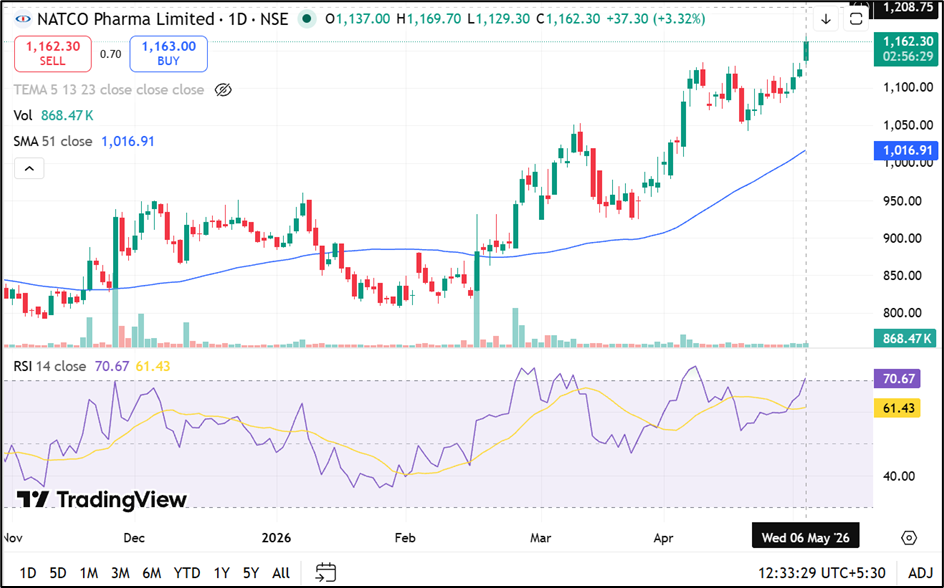
Source: TradingView
Return Performance Compared to Benchmark
The stock has delivered consistent outperformance across multiple timeframes. Over the past week, it gained 6.35%, compared to a marginal rise of 0.12% in the NIFTY 500 index.
On a one-month basis, the stock advanced 13.07%, outperforming the benchmark’s 8.05% gain. Year-to-date returns stand at 30.94%, while one-year returns are at 40.12%, both significantly higher than benchmark performance.
Over a three-year period, the stock delivered 91.28% returns compared to 49.88% for the index. However, five-year returns at 23.17% lag behind the benchmark’s 83.17% gain.
Trading Activity and Liquidity Indicators
Trading activity remained relatively strong, with volumes of 8.58 lakh shares and a traded value of ₹98.93 crore. The stock’s impact cost stood at 0.03, indicating high liquidity and efficient price discovery.
The deliverable quantity as a percentage of traded volume was 45.03%, reflecting a balanced mix of trading and delivery-based participation.
Market Capitalisation and Volatility
Natco Pharma has a total market capitalisation of ₹20,823.31 crore, with a free float market cap of ₹10,402.99 crore.
The stock recorded daily volatility of 2.37% and annualised volatility of 45.28%. The applicable margin rate stands at 18.78%.
52-Week Range and Technical Levels
The stock reached its 52-week high of ₹1,169.70 during the session, while the 52-week low stands at ₹775.00, recorded on May 9, 2025.
The price band is set at 20%, with an upper band of ₹1,350.00 and a lower band of ₹900.00, defining the permissible trading range.
Key Risks
- Regulatory changes in pharmaceuticals may impact product approvals and revenues.
- Dependence on key products could affect earnings concentration risk.
- Pricing pressures in global generics markets may influence margins.
- Currency fluctuations may impact export-driven revenue streams.
Summary
Natco Pharma (NSE:NATCOPHARM) shares rose 3.34% to ₹1,162.60, nearing their 52-week high during the session. The stock has delivered strong returns across one-month, year-to-date, and one-year periods, outperforming benchmark indices. Trading activity remained high with strong liquidity indicators. Despite positive momentum, long-term performance over five years trails broader market benchmarks.
FAQs
Q: Why did Natco Pharma stock rise today?
A: The stock gained over 3% and approached its 52-week high amid continued positive price momentum.
Q: How has Natco Pharma performed over the past year?
A: The stock delivered 40.12% returns over one year, outperforming the broader market indices.
Q: What is the stock’s 52-week range?
A: The 52-week high is ₹1,169.70, while the 52-week low is ₹775.00.