
Highlights
- Lupin stock gained 3.29%, touching a fresh 52-week high during the session.
- The stock delivered 244.15% returns over three years, outperforming midcap benchmarks.
- Trading activity remained strong with high volumes and low impact cost.
Shares of Lupin Limited (NSE:LUPIN) were trading at ₹2,422.40 on May 6, 2026, up 3.38% from the previous close of ₹2,343.30. The stock opened at ₹2,362.30 and touched an intraday high of ₹2,430.50, which also marks its 52-week high. The day’s low stood at ₹2,350.40, indicating steady upward movement through the session.
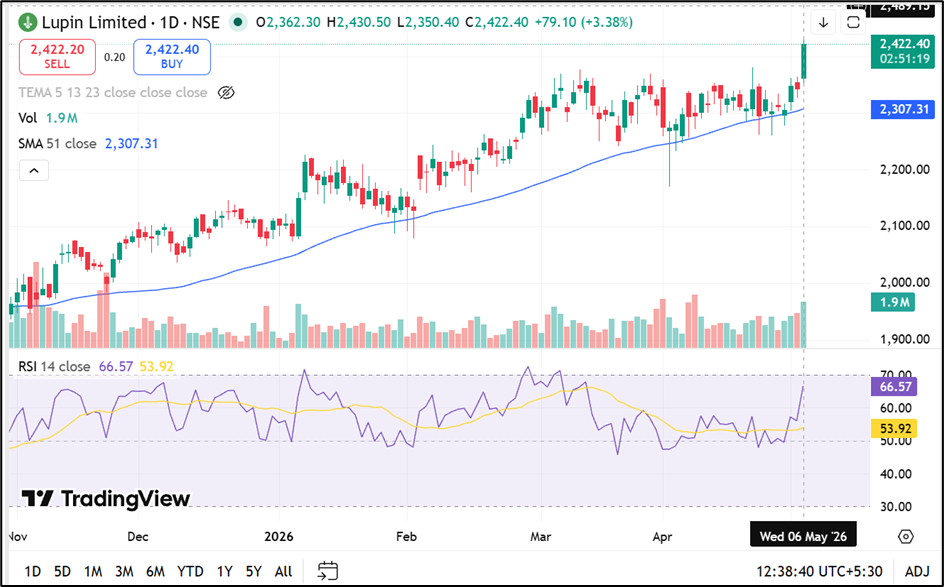
Source: TradingView
Return Performance Versus Benchmark
The stock has delivered mixed performance across different timeframes relative to the NIFTY MIDCAP 50 index. Over the past week, it gained 4.87%, outperforming the benchmark’s 1.12% rise.
On a one-month basis, the stock rose 6.32%, compared to an 11.04% gain in the index. Year-to-date returns stand at 15.27%, versus a marginal decline of 0.71% in the benchmark.
Over a one-year period, the stock delivered 18.30% returns, ahead of the index’s 13.88%. Over three years, it surged 244.15%, significantly outperforming the benchmark’s 90.55%. However, five-year returns of 102.29% trail the index’s 152.09% gain.
Trading Activity and Liquidity Indicators
Trading volumes stood at 18.74 lakh shares, translating into a traded value of ₹450.09 crore. The stock’s impact cost was reported at 0.02, indicating high liquidity and efficient price discovery.
The deliverable quantity as a percentage of traded volume stood at 46.42%, suggesting a balanced mix of trading and investment activity.
Market Capitalisation and Volatility
Lupin has a total market capitalisation of ₹1,10,820.22 crore, with a free float market cap of ₹58,665.84 crore.
The stock recorded daily volatility of 1.43% and annualised volatility of 27.32%. The applicable margin rate stands at 12.56%.
52-Week Range and Technical Levels
The stock reached its 52-week high of ₹2,430.50 during the session, while the 52-week low stands at ₹1,836.80, recorded on August 6, 2025.
The stock currently trades without a fixed price band, allowing broader price movement during trading sessions.
Key Risks
- Regulatory approvals and compliance issues may impact pharmaceutical product pipelines.
- Pricing pressure in global generics markets may affect profitability margins.
- Currency fluctuations may influence export revenue and earnings stability.
- Dependence on key geographies may expose business to regional risks.
Summary
Lupin (NSE:LUPIN) shares rose 3.29% to ₹2,420.50, hitting a fresh 52-week high during the session. The stock has delivered strong long-term returns, particularly over three years, outperforming midcap benchmarks.
Trading activity remained high with strong liquidity indicators. While short-term performance is mixed, the stock continues to show upward momentum supported by sustained investor participation.
FAQs
Q: Why did Lupin stock rise today?
A: The stock gained over 3% and reached a 52-week high, reflecting ongoing price momentum.
Q: How has Lupin performed over the long term?
A: It delivered 244.15% returns over three years, significantly outperforming the midcap benchmark index.
Q: What is Lupin’s 52-week range?
A: The 52-week high is ₹2,430.50, while the 52-week low is ₹1,836.80.