
Highlights
- Stock Gains Continue: Apollo Hospitals shares climbed over 2% during Thursday’s trading session.
- Near Record Levels: The stock traded close to its 52-week high of ₹8,099.50.
- Long-Term Returns Visible: Apollo Hospitals delivered over 142% returns in the last five years.
Apollo Hospitals Enterprise Limited shares moved higher during Thursday’s trading session and traded around ₹8,030.50, up 2.47% from the previous close of ₹7,837. The stock opened at ₹7,837 and touched an intraday high of ₹8,062.50. The day’s low remained at ₹7,812.50.
The stock is currently trading close to its 52-week high of ₹8,099.50 recorded on 23 October 2025. The 52-week low stands at ₹6,677.50 recorded on 9 May 2025. Trading activity remained active with traded volume of around 6.29 lakh shares and traded value exceeding ₹503 Crore.
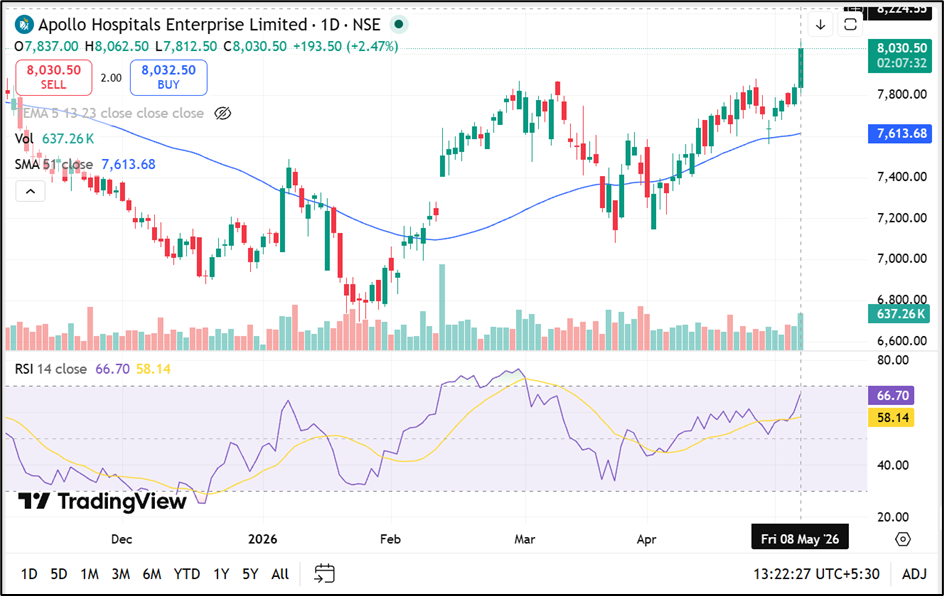
Source: tradingView
Return Performance
Apollo Hospitals Enterprise Limited has outperformed benchmark indices across multiple periods. The stock gained around 5.19% in one week compared to NIFTY 50 return of 0.68%. In one month, the stock advanced 8.53% while the benchmark remained largely flat.
On a year-to-date basis, Apollo Hospitals shares gained nearly 12.96% despite weakness in broader markets. Over a one-year period, the stock delivered returns of around 17.24%. Long-term performance also remained notable with gains of 73.68% over three years and 142.63% over five years.
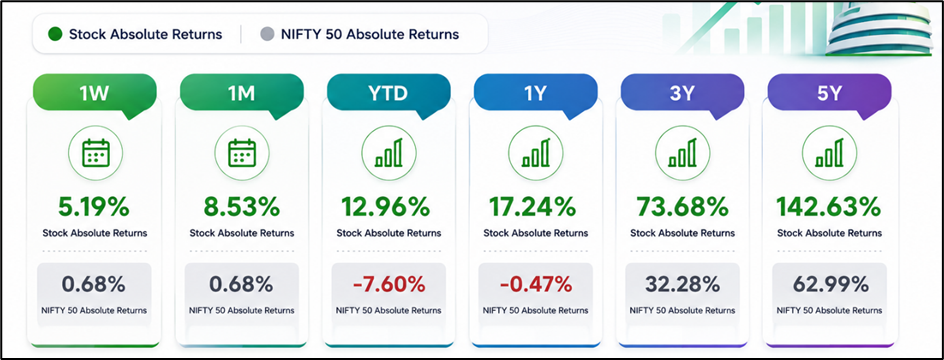
Source: NSE
Company Background
Apollo Hospitals was established in 1983 by Dr. Prathap C. Reddy and is recognised as one of the early corporate healthcare operators in India. The company operates across hospitals, pharmacies, diagnostic services, primary care clinics and retail healthcare segments. Over the years, Apollo Hospitals expanded its healthcare network across multiple cities and healthcare service categories.
Market Position and Business Presence
The company operates as an integrated healthcare provider with presence across hospitals, pharmacies and diagnostics businesses. Apollo Hospitals has continued expanding healthcare access through both physical and digital healthcare platforms. The company remains part of India’s listed healthcare sector with significant market capitalisation exceeding ₹1.15 Lakh Crore.
Risks
High valuation levels may increase volatility during broader market corrections. Regulatory changes in healthcare pricing may impact hospital revenue growth. Rising operational costs could affect margins in healthcare delivery business. Competition from private healthcare chains may impact market share expansion.
Summary
Apollo Hospitals Enterprise shares gained over 2% and traded near their 52-week high during Thursday’s session. The stock has outperformed benchmark indices across short-term and long-term periods, delivering over 142% returns in five years. The company continues operating across hospitals, pharmacies and diagnostics segments while investors monitor healthcare sector trends and valuation movement closely.
FAQs
Q: Why did Apollo Hospitals shares rise during Thursday’s session?
A: The stock gained around 2.48% and traded close to its 52-week high level during market trading.
Q: What are Apollo Hospitals’ long-term stock returns?
A: The stock delivered approximately 73.68% returns in three years and 142.63% returns over five years.
Q: What businesses does Apollo Hospitals operate in?
A: The company operates hospitals, pharmacies, diagnostics clinics, primary healthcare centres and retail healthcare service platforms.