
Highlights
- Ausom Enterprise shares gained more than 3% during Tuesday’s NSE session.
- The stock outperformed the NIFTY 50 across several return periods.
- Ausom Enterprise remained under ASM-1 surveillance measures on NSE.
Ausom Enterprise Limited (NSE:AUSOMENT) shares traded higher during the May 12 session on the National Stock Exchange. The stock was trading at ₹ 149.95, up 3.04% from the previous close of ₹ 145.52.
The stock opened at ₹ 164.90 and touched an intraday high of ₹ 164.90 before declining to a low of ₹ 148.00 during the session. Ausom Enterprise shares remained below their 52-week high of ₹ 178.00 recorded on January 19, 2026.
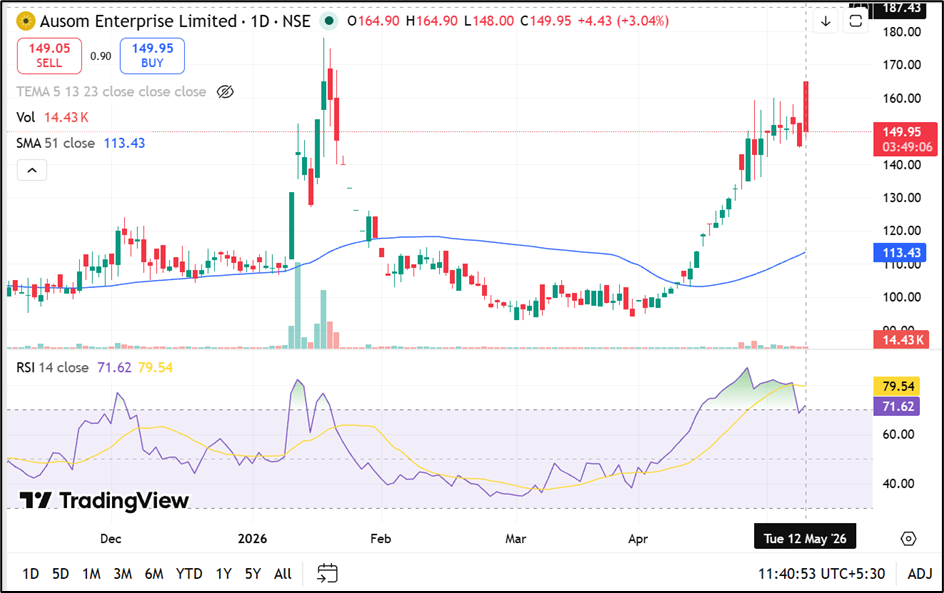
Source: TradingView
Trading Volumes and Market Capitalisation
The stock recorded traded volume of 0.14 lakh shares during the session, while traded value stood at ₹ 0.22 crore.
The company’s total market capitalisation stood at ₹ 204.29 crore, while free float market capitalisation was ₹ 53.73 crore. The stock’s VWAP during the session was ₹ 153.54.
Deliverable quantity as a percentage of traded quantity stood at 44.78%, while impact cost remained elevated at 1.52.
The applicable margin rate for the stock stood at 50.00%.
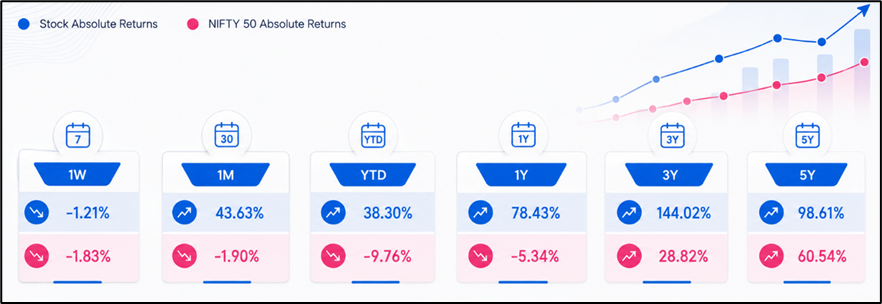
Performance Compared With NIFTY 50
Ausom Enterprise shares outperformed the NIFTY 50 index across multiple periods.
The stock gained 43.63% over one month compared with a 1.90% decline in the benchmark index. On a year-to-date basis, the stock advanced 38.30%, while the NIFTY 50 declined 9.76%.
Over one year, Ausom Enterprise shares rose 78.43%, compared with a 5.34% decline in the benchmark index.
The stock also delivered returns of 144.02% over three years and 98.61% over five years.
Source: NSE
Volatility and Business Overview
The stock recorded annualised volatility of 65.53%, while daily volatility stood at 3.43, indicating elevated price fluctuations.
The stock touched its 52-week low of ₹ 81.61 on May 12, 2025. The upper price band remained at ₹ 174.62, while the lower band stood at ₹ 116.42.
Exchange data highlighted ASM-1 surveillance measures and indicated less than 100 unique PANs traded in the previous 30 days.
According to the company profile, Ausom Enterprise operates in financial and commodity trading activities along with jewellery manufacturing and trading.
Key Risks Investors Monitor
- Low trading participation may increase price volatility significantly.
- ASM surveillance measures may impact investor sentiment.
- Commodity market fluctuations can influence business performance.
- Higher impact cost may affect trading efficiency in the stock.
Summary
Ausom Enterprise (NSE:AUSOMENT) shares gained more than 3% during Tuesday’s NSE trading session while continuing to outperform the NIFTY 50 index across multiple periods. The stock remained under ASM-1 surveillance measures and traded below its 52-week high. Investors continue monitoring liquidity levels, commodity market trends, volatility, and surveillance indicators linked to the company’s shares.
FAQs
Q: What was Ausom Enterprise share price on May 12, 2026?
A: Ausom Enterprise shares traded at ₹ 149.95, up 3.04% during the NSE session.
Q: What is the 52-week high level of Ausom Enterprise shares?
A: The stock’s 52-week high was ₹ 178.00, recorded on January 19, 2026.
Q: What surveillance measure applies to Ausom Enterprise stock?
A: Exchange data indicated ASM-1 surveillance measures for the company’s shares.