

BCC Fuba India Limited reported higher revenue and profit for the financial year ended March 31, 2026, supported by growth in its Printed Circuit Boards business and the addition of an Electronics Manufacturing Services segment.
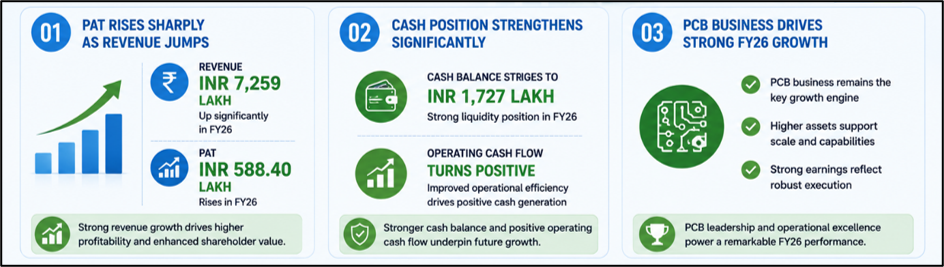
The company posted audited standalone revenue from operations of INR 7,259.15 lakh in FY26, compared with INR 4,706.86 lakh in FY25. Profit after tax rose to INR 588.40 lakh from INR 373.82 lakh a year earlier.
BCC Fuba India’s board approved the audited financial results on May 27, 2026. The statutory auditor, Bhagi Bhardwaj Gaur & Co., issued an unmodified audit opinion on both standalone and consolidated financial statements.
 Source: Analysis by Kalkine
Revenue Expansion Supports FY26 Earnings
Standalone total income for FY26 stood at INR 7,268.20 lakh, compared with INR 4,730.32 lakh in the previous financial year. The increase was mainly linked to higher revenue from the Printed Circuit Boards segment.
The company’s standalone profit before tax rose to INR 818.81 lakh during FY26 from INR 522.79 lakh in FY25. Total expenses increased to INR 6,449.39 lakh from INR 4,207.53 lakh, reflecting higher material consumption, employee expenses, and operational costs.
Cost of materials consumed rose to INR 4,477.31 lakh during the year, while employee benefits expense increased to INR 896.82 lakh.
On a quarterly basis, standalone revenue from operations for the March 2026 quarter stood at INR 2,278.72 lakh against INR 1,271.81 lakh reported in the corresponding quarter last year. Quarterly profit after tax increased to INR 194.50 lakh from INR 95.67 lakh.
Balance Sheet Reflects Asset Growth
BCC Fuba India reported standalone total assets of INR 8,091.71 lakh as of March 31, 2026, compared with INR 4,090.60 lakh in FY25.
Property, plant and equipment increased to INR 2,225.93 lakh from INR 1,453.93 lakh. Inventories rose to INR 1,443.50 lakh, while trade receivables stood at INR 1,903.63 lakh.
Cash and cash equivalents increased significantly to INR 1,727.75 lakh from INR 3.33 lakh a year earlier.
Total equity climbed to INR 4,590.22 lakh compared with INR 2,315.68 lakh in FY25. Equity share capital increased to INR 1,760.66 lakh.
Current borrowings rose to INR 1,448.86 lakh, while non-current borrowings declined to INR 160.42 lakh.
Consolidated Numbers Include EMS Segment
On a consolidated basis, FY26 revenue from operations stood at INR 7,265.42 lakh, compared with INR 4,706.86 lakh in FY25.
Consolidated profit after tax came at INR 576.46 lakh versus INR 373.82 lakh in the previous year.
The Electronics Manufacturing Services segment contributed revenue of INR 6.27 lakh during FY26, while the Printed Circuit Boards business remained the primary contributor with segment revenue of INR 7,259.15 lakh.
The consolidated balance sheet also reflected the inclusion of lease liabilities, right-of-use assets, and non-controlling interest related to subsidiary operations.
Cash Flow Position Improves
Standalone net cash flow from operating activities turned positive at INR 927.41 lakh during FY26, compared with negative INR 8.65 lakh in FY25.
The company generated higher operating cash flows despite increases in inventories and trade receivables. Trade payables also increased during the year.
Net cash used in investing activities stood at INR 1,190.89 lakh due to capital expenditure and investment purchases. Financing activities generated INR 1,987.90 lakh, mainly supported by proceeds from issue of shares and borrowings.
Auditor Issues Unmodified Opinion
The statutory auditor stated that the standalone and consolidated financial statements presented a true and fair view in accordance with applicable accounting standards and SEBI Listing Regulations.
The audit report also noted that the company’s quarterly figures for March 2026 represented balancing figures between audited annual results and published nine-month unaudited figures reviewed earlier.
BCC Fuba India additionally informed exchanges that it does not qualify as a “Large Corporate” under the applicable SEBI circular related to borrowings.
Key Risks Investors Should Track
- Rising raw material costs may affect operating margins and manufacturing expenses.
- Higher trade receivables could impact working capital management and cash flow cycles.
- Increased borrowings may raise finance costs in future reporting periods.
- Dependence on major customers may affect revenue concentration risks.
Summary
BCC Fuba India reported higher FY26 revenue and profitability supported by growth in its Printed Circuit Boards business. Standalone revenue crossed INR 7,259 lakh, while profit after tax increased to INR 588.40 lakh. The company also reported higher assets, stronger cash balances, and positive operating cash flow during the year. The statutory auditor issued an unmodified opinion on standalone and consolidated financial statements for FY26.
FAQs
Q: What was BCC Fuba India’s FY26 standalone revenue?
A: The company reported standalone revenue from operations of INR 7,259.15 lakh during FY26.
Q: Did BCC Fuba India receive a qualified audit opinion for FY26?
A: No, the statutory auditor issued an unmodified opinion on standalone and consolidated FY26 financial statements.
Q: Which business segment contributed most to FY26 revenue?
A: The Printed Circuit Boards segment remained the primary contributor to the company’s total revenue during FY26.