
Highlights
- Finolex Cables stock rises 3.81 percent, hitting a fresh 52-week high.
- One-month returns exceed 32 percent, outperforming NIFTY 500 benchmark index.
- December 2025 net profit reported at ₹16,403 lakh on consolidated basis.
Shares of Finolex Cables Limited (NSE:FINCABLES) traded at ₹1,055.35 on May 5, 2026, gaining 3.84 percent from the previous close of ₹1,016.30. The stock opened at ₹1,022.00 and moved within a range of ₹1,005.15 to ₹1,098.90 during the session.
The intraday high of ₹1,098.90 marks its 52-week high, indicating continued buying activity. Trading volumes stood at 20.66 lakh shares, with a traded value of ₹220.09 crore. The VWAP was recorded at ₹1,065.22, reflecting steady participation across price levels.
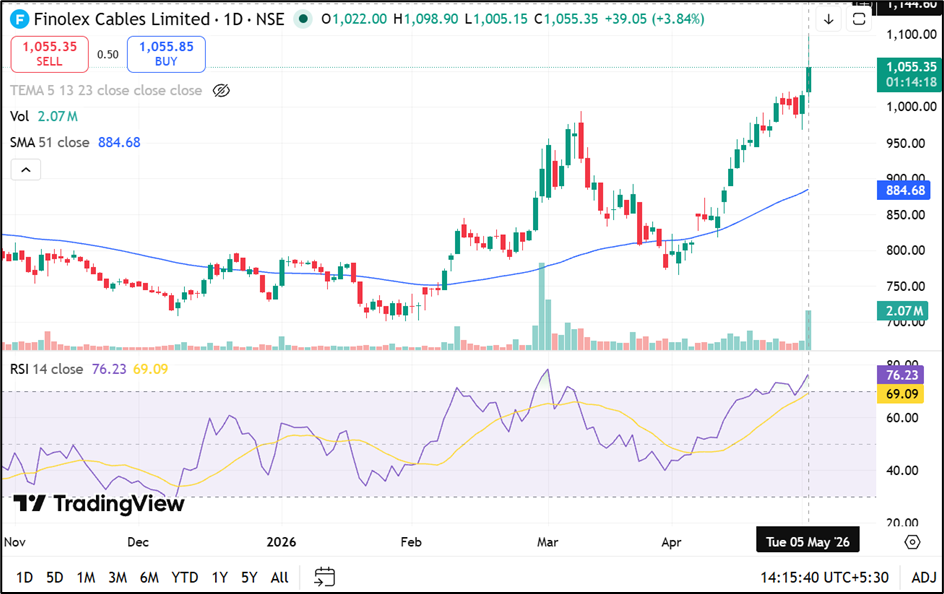
Source: TradingView
Returns Performance: Strong Short-Term Gains
Finolex Cables has delivered solid returns across recent periods. The stock gained 5.04 percent over one week and 32.26 percent over the past month, outperforming the NIFTY 500 index.
Year-to-date returns stand at 34.16 percent, while one-year returns are at 15.52 percent. Over longer durations, the stock has delivered 17.09 percent returns over three years and 192.28 percent over five years, exceeding benchmark performance in the long term.
Financial Performance: December 2025 Snapshot
For the quarter ended December 31, 2025, the company reported consolidated total income of ₹1,63,999 lakh. Profit before tax stood at ₹18,350 lakh, while net profit was ₹16,403 lakh, with earnings per share at ₹10.73.
On a standalone basis, total income was ₹1,63,999 lakh, with net profit at ₹13,597 lakh and EPS at ₹8.89. These figures reflect reported financials without adjustments or projections.
Market Metrics and Liquidity Indicators
Finolex Cables has a total market capitalisation of ₹16,135.10 crore, with a free float market cap of ₹7,956.17 crore. The impact cost remains low at 0.05, indicating relatively efficient trade execution.
Deliverable quantity stood at 26.00 percent of traded volume, suggesting a mix of delivery-based and trading activity.
Volatility and Trading Conditions
The stock recorded daily volatility of 2.32 percent and annualised volatility of 44.32 percent, indicating moderate price fluctuations. The applicable margin rate is 18.51 percent.
The stock trades within a 20 percent price band, with an upper band of ₹1,219.55 and a lower band of ₹813.05. The tick size is ₹0.05.
Key Risks
- Moderate volatility may lead to short-term price fluctuations.
- Strong recent rally may increase chances of price corrections.
- Lower delivery percentage indicates trading-driven activity.
- Financial data based on December quarter, not most recent period.
Summary
Finolex Cables (NSE:FINCABLES) shares rose nearly 4 percent, reaching a fresh 52-week high during the session. The stock has delivered strong short-term returns, outperforming benchmark indices over the past month and year-to-date period. December 2025 financials reflect reported profitability, while moderate volatility and recent price movement indicate potential risks for market participants.
FAQs
Q: Why did Finolex Cables stock rise today?
A: The stock gained due to positive momentum, steady trading volumes, and strong short-term performance compared to benchmark indices.
Q: What are Finolex Cables’ latest financial results?
A: The company reported December 2025 consolidated net profit of ₹16,403 lakh with EPS of ₹10.73.
Q: Is Finolex Cables stock volatile?
A: The stock shows moderate volatility with 44.32 percent annualised volatility and controlled daily price movements.