
Highlights
- Aequs shares touched a fresh 52-week high during Friday’s trading session.
- The stock delivered over 55 percent returns on a year-to-date basis.
- Trading volumes crossed 32 lakh shares amid elevated market activity.
Shares of Aequs Limited (NSE:AEQUS) traded higher on 22 May 2026, with the stock quoted at Rs 215.48. The stock gained 0.34 percent compared to its previous close. During the trading session, Aequs shares touched a fresh 52-week high of Rs 223.85.
The stock has witnessed notable price movement in recent weeks, supported by increased trading activity and market participation. The stock traded in the EQ series, while exchange data also highlighted that the high-low price variation exceeded 75 percent during the previous three months.
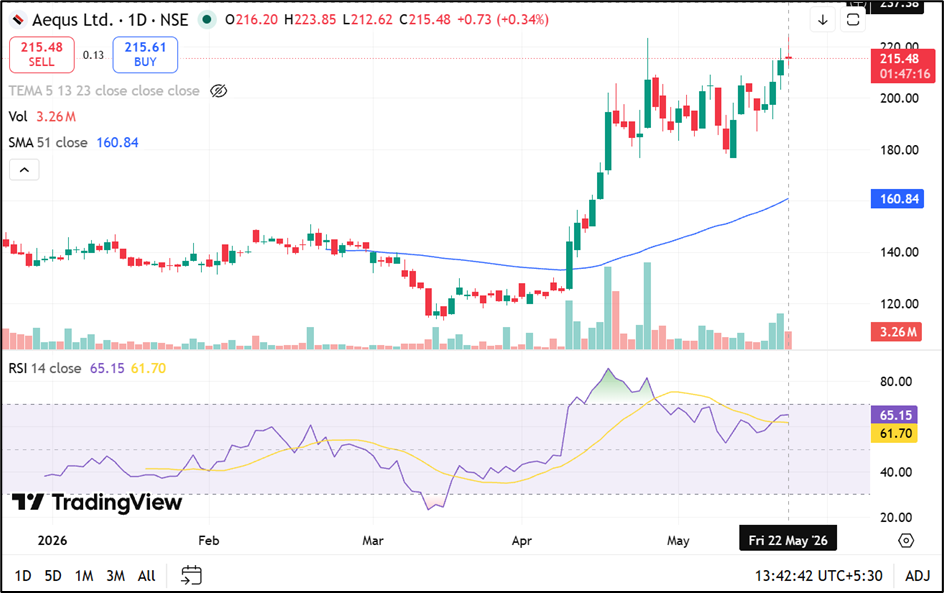
Source: TradingView
Trading Activity And Market Capitalisation
Aequs recorded traded volumes of 32.48 lakh shares during the session, with traded value reaching approximately Rs 71.05 crore. The company’s total market capitalisation stood at around Rs 14,437.42 crore, while free float market capitalisation was reported at Rs 1,750.69 crore.
Deliverable quantity accounted for 35.30 percent of traded volume, indicating a mix of delivery-based and short-term trading activity in the counter.
Volatility Indicators In Focus
Exchange data showed daily volatility at 2.56 percent, while annualised volatility stood significantly higher at 48.91 percent. The applicable margin rate for the stock was 20.05 percent.
The stock’s lower and upper trading bands for the session were fixed at Rs 193.28 and Rs 236.22 respectively. Aequs shares also traded with a tick size of Re 0.01. The company’s face value stands at Rs 10 per share.
Strong Short-Term And YTD Returns
Aequs has outperformed the broader market across multiple short-term periods. The stock generated returns of 6.30 percent over the past one week, compared to 0.85 percent gains in the NIFTY Total Market index.
On a one-month basis, the stock advanced 13.88 percent, while the benchmark index declined 1.07 percent. Year-to-date returns stood at 55.78 percent against a 4.67 percent decline in the broader market index. The stock’s sharp movement during recent months has also resulted in relatively elevated volatility levels.
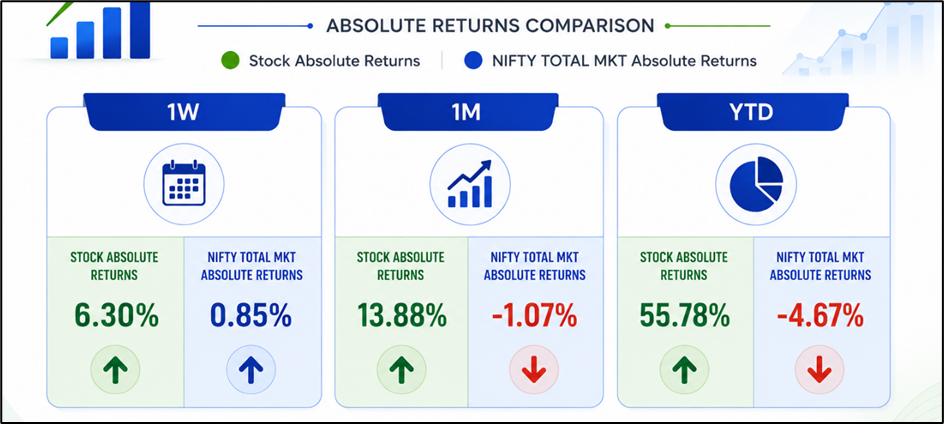
Source: NSE
Key Risks
- Elevated volatility may result in sharp short-term stock price fluctuations.
- Lower free float market capitalisation may impact liquidity during volatile sessions.
- High price variation may increase speculative trading activity in the stock.
- Broader market weakness may affect momentum in mid-cap industrial counters.
Summary
Aequs (NSE:AEQUS) shares remained in focus after the stock touched a fresh 52-week high on 22 May 2026. The counter delivered strong year-to-date returns and witnessed active trading volumes during the session. Exchange indicators also reflected elevated volatility and significant price variation over recent months. Investors tracked trading activity, delivery data, and broader market movement while monitoring the stock’s recent momentum.
FAQs
Q: Why was Aequs stock in focus on 22 May 2026?
A: The stock touched a fresh 52-week high and recorded active trading volumes during the session.
Q: What are Aequs’ year-to-date returns in 2026?
A: Aequs shares gained 55.78 percent on a year-to-date basis as of 22 May 2026.
Q: What was Aequs’ 52-week high price?
A: The stock touched its 52-week high of Rs 223.85 on 22 May 2026.