
A Raipur-based structural steel maker with wafer-thin operating margins, modest earnings, and negligible institutional interest has become one of India's most remarkable small-cap momentum stories. The numbers behind the rally demand scrutiny.
There is a class of Indian small-cap stock that defies conventional valuation logic — companies whose share prices have detached dramatically from their underlying financial fundamentals, driven by a potent combination of narrative momentum, thin liquidity, and retail investor enthusiasm that can sustain re-ratings far longer, and to far greater extremes, than institutional logic would predict. Mahamaya Steel Industries Limited (NSE: MAHASTEEL) is a textbook example of this phenomenon, and examining it closely reveals both the extraordinary opportunity and the considerable risk embedded in India's small-cap momentum trade.
On 2 April 2026, Mahamaya Steel's shares trade at ₹926 — down 3.24% on the day but sitting on a staggering one-year return of 287%. A ₹1 lakh investment in the stock twelve months ago would be worth approximately ₹3.87 lakh today. Over three years, the stock has delivered a price CAGR of 164%. Over five years, 62%. Over ten years, 26% annually — a genuinely impressive long-term track record for a company that most institutional investors have never heard of.
Yet the business generating this extraordinary market attention is, by most conventional metrics, a modest one. Incorporated in 1988 and headquartered in Raipur, Chhattisgarh — India's steel heartland — Mahamaya Steel manufactures structural steel products including angles, beams, joists, channels, rounds, flats, and railway sleeper bars at its heavy steel structural mill, Steel Melting Shop, and gas plant. It is an ISO 9001:2015 and ISO 14001:2015 certified operation with a legitimate manufacturing heritage and genuine product differentiation — it is one of very few Indian mills capable of producing 600mm joists and 250mm angles, serving construction, automobile, railway, and power sector clients.
But the numbers behind the rally tell a story that every investor considering Mahamaya Steel at current prices needs to understand in full.
The Valuation Problem: 146x Earnings on 2.6% Margins
The most arresting single figure in Mahamaya Steel's financial profile is its Price-to-Earnings ratio of 146x — a valuation that would be demanding for a high-growth technology platform, let alone a structural steel manufacturer in a commodity industry.
To contextualise this number, consider the peer group. APL Apollo Tubes — India's largest structural steel tubes company with a market cap of ₹51,414 Cr and genuine scale advantages — trades at 45x earnings. Welspun Corp, one of India's largest pipe manufacturers, trades at 14x. Shyam Metalics trades at 22x. Ratnamani Metals at 25x. The sector median P/E is 17.9x. Mahamaya Steel, at 146x, trades at more than eight times the sector median multiple — on the basis of quarterly net profit of just ₹1.91 Cr.
Chart 1: Peer Valuation Comparison — P/E Ratio vs ROCE
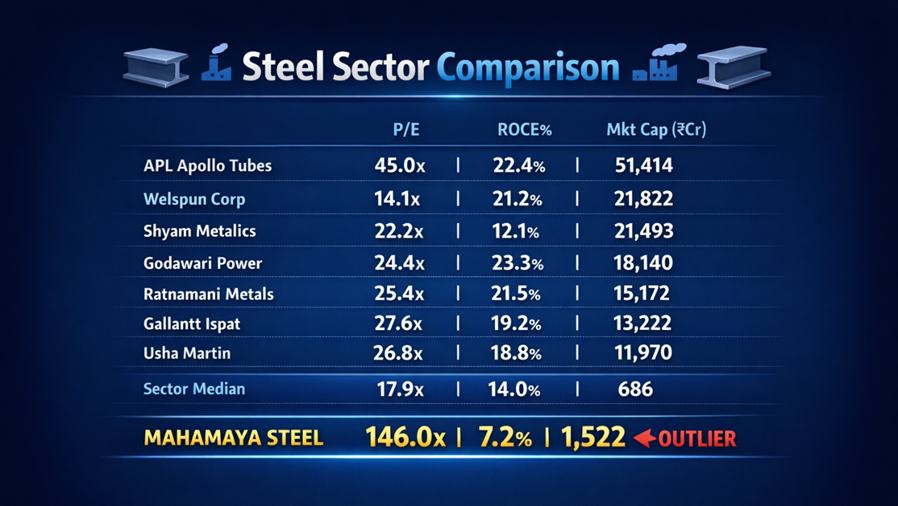
Data Source: REFINITIV, Analysis: Kalkine Group
The table makes the anomaly starkly visible. Every peer in the comparison group trades between 14x and 45x earnings and delivers ROCE between 12% and 23%. Mahamaya Steel trades at 146x and delivers ROCE of just 7.15% — the lowest in the group by a significant margin. It is paying more for less on every relevant metric.
The Earnings Reality: Thin Margins Through the Cycle
The reason the P/E ratio is so extreme is not that Mahamaya Steel has no earnings — it does, and they have been growing. The reason is that the earnings base is very small relative to a share price that has been propelled to extraordinary heights by momentum buying.
Chart 2: Quarterly Revenue and Net Profit Trend (₹ Crores)
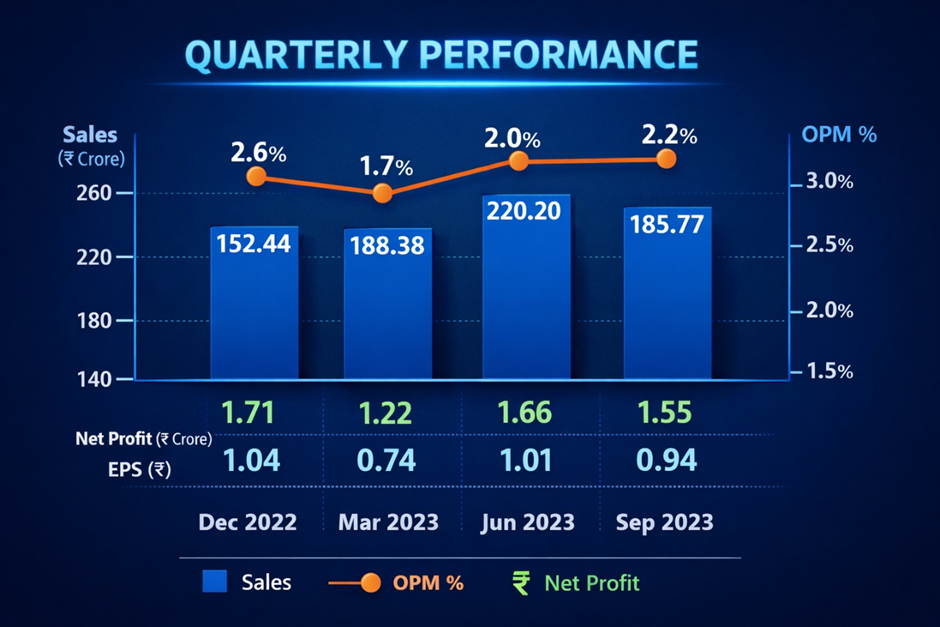
Data Source: REFINITIV, Analysis: Kalkine Group
Three observations stand out from the quarterly data. First, revenues have grown meaningfully — from ₹152 Cr in December 2022 to ₹224 Cr in December 2025, representing solid 12–17% annual growth for a commodity manufacturer. Second, operating margins have remained extraordinarily compressed throughout — ranging from a low of 1.68% (March 2024) to a high of 3.26% (March 2025), averaging approximately 2.2% across the period. Third, the March 2025 quarter produced a dramatic earnings anomaly — net profit of ₹5.41 Cr against the typical ₹1–2 Cr range — driven by a profit before tax jump to ₹6.86 Cr from the typical ₹1–3 Cr band. This single quarter's performance, if annualised, would imply earnings power significantly above the company's actual run rate and may have contributed to the re-rating momentum.
The December 2025 quarterly profit of ₹1.91 Cr — the most recent reported figure — represents a 94.90% year-on-year increase from ₹0.98 Cr in December 2024. This growth rate sounds impressive until the absolute numbers are considered: the business earned ₹1.91 Cr in a quarter on ₹224 Cr of sales. Expressed differently, for every ₹100 of steel Mahamaya sold in December 2025, it kept less than ₹0.86 as net profit.
Chart 3: Annual Revenue, Operating Profit and Net Profit (₹ Crores)
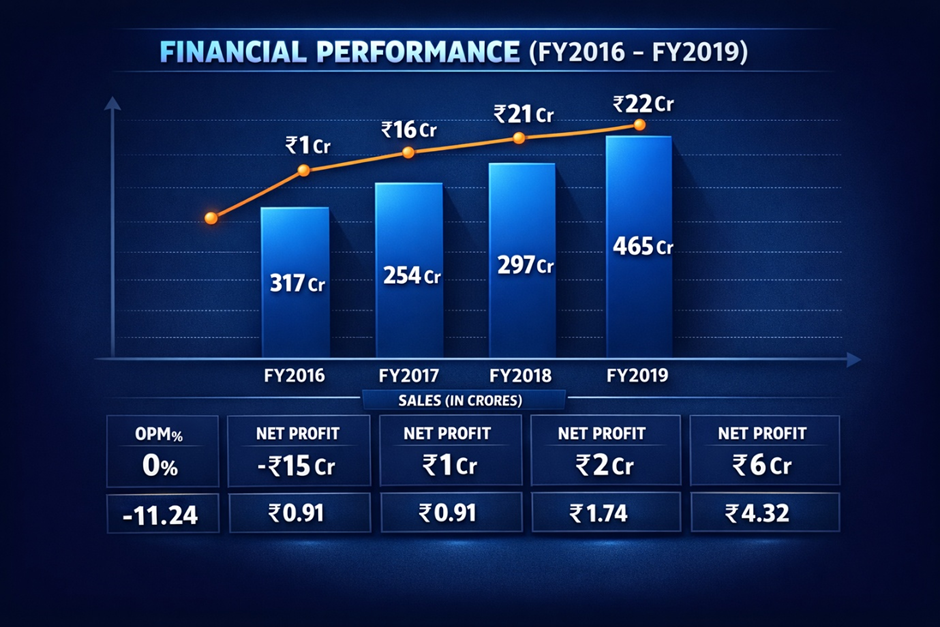
Data Source: REFINITIV, Analysis: Kalkine Group
───────────────────────────────────────────────────────────
The long-run picture is one of consistent, modest improvement punctuated by cyclical volatility. Revenue has grown from ₹251 Cr (FY2021 trough) to ₹856 Cr (TTM) — a genuine tripling in four years that reflects both volume growth and steel price inflation. But operating profits have moved from ₹13 Cr to ₹24 Cr over the same period — and net profits from ₹1 Cr to ₹11 Cr (TTM). The 5-year profit CAGR of 25% and the extraordinary TTM profit growth of 210% are real — but they are growing from such a small base that the absolute earnings remain insufficient to justify the current market capitalisation by conventional metrics.
At TTM EPS of ₹6.65 and a share price of ₹926, the stock trades at 139x trailing earnings. For context, the broader Nifty 50 index trades at approximately 22x earnings. Mahamaya Steel is priced at more than six times the broad market multiple.
The Balance Sheet: Conservative but Small
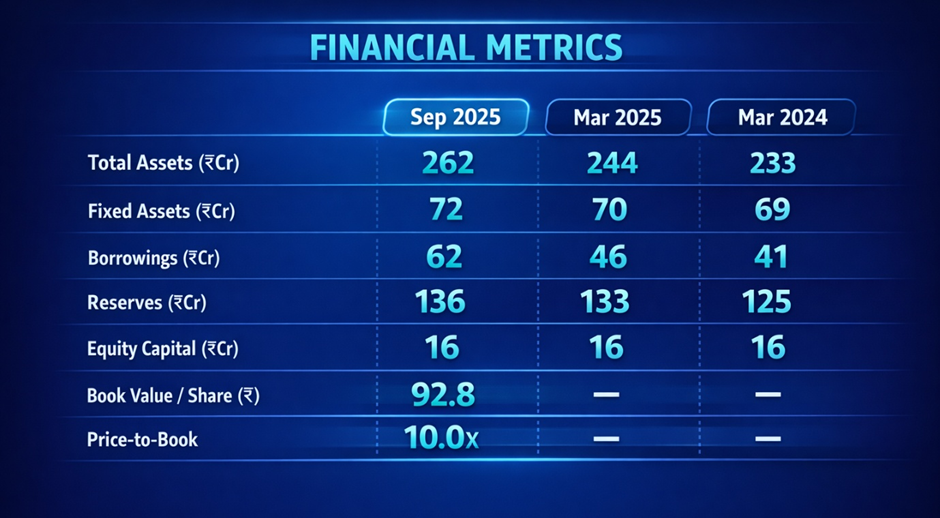
Data Source: REFINITIV, Analysis: Kalkine Group
────────────────────────────────────────────────────────
The balance sheet profile is that of a conservative, modestly leveraged business. Total assets of ₹262 Cr are small but stable. Borrowings have increased from ₹41 Cr (FY2024) to ₹62 Cr (Sep 2025) — a 51% increase that warrants monitoring but remains at manageable levels relative to the equity base. The company carries no significant financial distress risk.
The Price-to-Book ratio of 10.0x is a key concern — is a direct consequence of the share price re-rating. Book value per share stands at ₹92.8, against a market price of ₹926. The market is paying ₹10 for every ₹1 of net assets. For comparison, the sector median P/B would imply a fair value considerably lower than the current price.
Cash Flow Analysis: Modest but Real
Source: REFINITIV
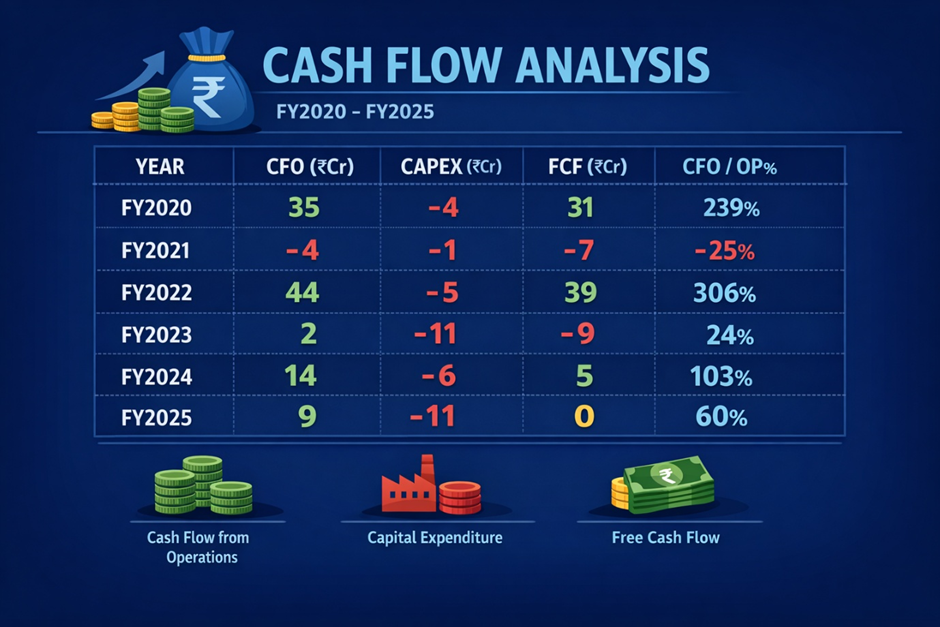
Data Source: REFINITIV, Analysis: Kalkine Group
──────────────────────────────────────────────────────────
The cash flow record is mixed. Operating cash flow has been positive in most years, and the CFO/Operating Profit ratio has generally been healthy — suggesting earnings quality is reasonable and profits are converting to cash. However, free cash flow has been volatile and marginally negative in FY2025, as modest capex investment absorbed operating cash generation. This is not a cash-generative business at scale — it is a tightly managed operation with limited surplus capital.
Working Capital: Efficiency is the Standout Positive
Among all of Mahamaya Steel's financial metrics, the working capital ratios are genuinely impressive and represent a legitimate operational strength.
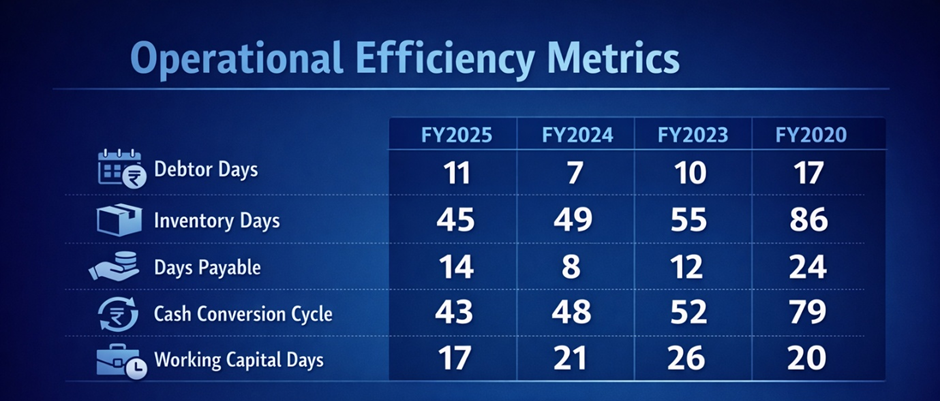
Data Source: REFINITIV, Analysis: Kalkine Group
─────────────────────────────────────────────────────────
Debtor days of just 11 days in FY2025 is exceptionally tight for a B2B industrial manufacturer — it suggests Mahamaya's customers pay quickly and that the company has pricing and relationship leverage in its supply chain. The cash conversion cycle has improved from 79 days (FY2020) to 43 days (FY2025) — a 45% improvement reflecting genuine operational discipline. In an industry where working capital management is critical to profitability given thin margins, this is a real competitive advantage.
The Latest Announcements: Volume Data Tells the Story
Source: NSE/BSE filings
2 April 2026 — March 2026 Monthly Business Update: Mahamaya Steel reported March 2026 sales of 13,982.83 MT — a monthly sales volume figure. This is the most recent operational data available.
5 March 2026 — February 2026 Monthly Business Update: The company reported February 2026 sales of 21,100.75 MT — notably higher than March. The sequential decline from 21,100 MT in February to 13,983 MT in March (a 33.7% volume drop month-on-month) is a material datapoint that deserves attention. Whether this reflects seasonal patterns, market demand softness, or production scheduling is not disclosed in the filing. Investors should monitor April 2026 volume data closely.
28 March 2026 — Trading Window Closure: The trading window closed from 1 April 2026 until 48 hours after the Q4 FY2026 results announcement — confirming full-year results are imminent.
13 February 2026 — Q3 FY2026 Results: Board approved standalone and consolidated unaudited results for Q3 and nine-month period ended 31 December 2025. These are the results reflected in the December 2025 quarterly data discussed above.
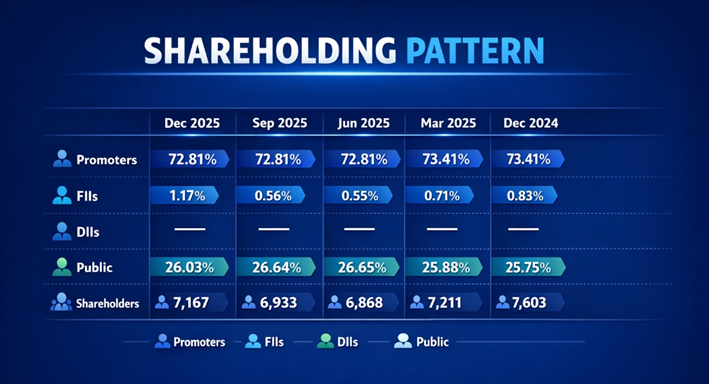
Shareholding: Promoter Control, Negligible Institutions
Data Source: REFINITIV, Analysis: Kalkine Group
────────────────────────────────────────────────────────────────────
The shareholding pattern reveals a business almost entirely in promoter and retail hands. Promoter holding is stable and high at 72.81% — a positive governance signal but one that also means the effective free float is approximately 27% of shares, or just ₹411 Cr at current prices. DII (domestic institutional investor) holding is zero. FII holding, while rising from zero to 1.17%, remains negligible in absolute terms.
This ownership profile explains much about the stock's price behaviour. With no institutional anchor, no analyst coverage that would create a valuation ceiling, and a thin free float concentrated in retail hands, the stock is vulnerable to sharp moves in both directions. The 287% one-year return was built on a free float of approximately ₹106–411 Cr — a market that can be moved meaningfully by relatively modest capital flows. The same characteristic that allowed the stock to rise 287% can drive equally sharp corrections when sentiment reverses.
Return on Equity: The Structural Weakness
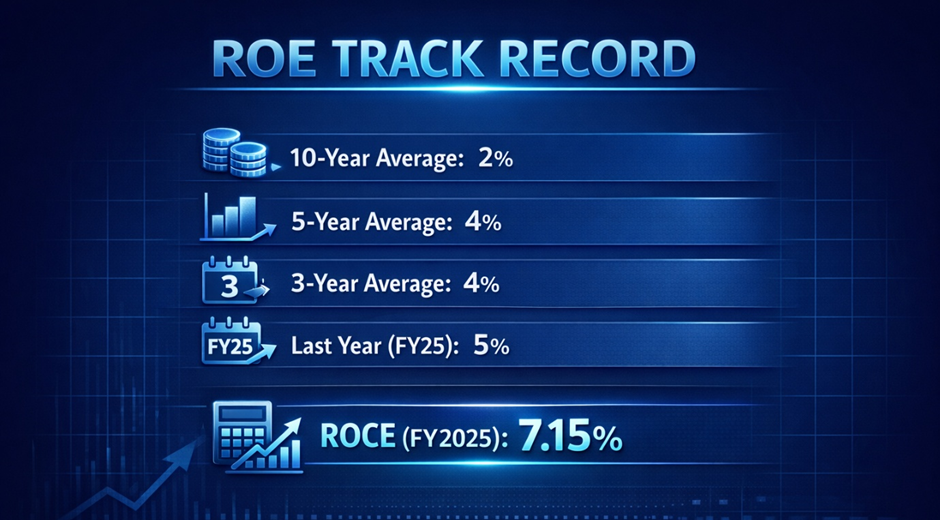
Data Source: REFINITIV, Analysis: Kalkine Group
A business that has generated an average return on equity of 2% over ten years and 4% over five years is not, by any objective measure, creating value for shareholders at the rate the market is currently pricing. The cost of equity for an Indian small-cap steel manufacturer — reflecting the risk premium required by investors — would typically be estimated at 14–18%. A business earning 5% ROE against a 14–18% cost of equity is destroying economic value, not creating it. This structural reality does not prevent share prices from rising — momentum, narrative, and liquidity dynamics operate independently of fundamental value in the short to medium term — but it establishes a clear ceiling on the valuation that can be sustainably supported by the underlying business economics.
The Re-Rating Narrative: What the Market Is Pricing
Understanding why Mahamaya Steel has re-rated so dramatically requires acknowledging what the market appears to be pricing — not current earnings but a future that looks meaningfully different from the present. The bull thesis likely rests on several pillars: India's infrastructure spending boom (the government's ₹11.1 lakh Cr capex in FY2026 creates substantial structural steel demand), Mahamaya's unique product capability in 600mm joists and 250mm angles serving premium industrial applications, the potential for margin expansion as volumes scale, and the broader re-rating of India's capital goods and infrastructure supply chain.
These are not frivolous arguments. India's infrastructure build-out is real and sustained. Mahamaya's niche manufacturing capability is genuine. The TTM profit growth of 210% — however small the absolute number — reflects accelerating earnings momentum. And the 10-year price CAGR of 26% suggests this is a business that has compounded value over time, even if modestly.
But at 146x P/E, the market has already priced in an extraordinary amount of this future. The stock is not cheap on any scenario that doesn't involve a dramatic, sustained expansion of margins and earnings that the company's entire history suggests would be unprecedented.
Verdict: A Remarkable Story With a Demanding Price
Mahamaya Steel Industries is a legitimate business — ISO-certified, niche-capable, conservatively managed, with improving working capital efficiency and a clean balance sheet. Its ten-year price CAGR of 26% and one-year return of 287% reflect genuine investor recognition of a company operating in India's most structurally supported sector.
But the valuation at 146x P/E, 10x book value, 7.15% ROCE, and 2.6% operating margins represents a profound disconnect between price and fundamentals that demands extreme caution. The DII ownership of zero — meaning no domestic mutual fund or insurance company has chosen to hold this stock — is perhaps the most telling institutional signal available.
The monthly volume decline from 21,101 MT (February 2026) to 13,983 MT (March 2026) is a near-term operational datapoint to watch carefully ahead of Q4 FY2026 results. If full-year earnings disappoint relative to the expectations embedded in a 146x multiple, the correction could be as dramatic as the rally.