
Highlights
- Tata Motors shares fell more than 1% during Tuesday’s NSE session.
- The stock traded below its 52-week high recorded in February 2026.
- Exchange data highlighted PE above 50 for four trailing quarters.
Tata Motors Limited (NSE:TMCV) shares traded lower during the May 12 session on the National Stock Exchange. The stock was trading at INR 404.80, down 1.36% from the previous close of INR 411.00.
The stock opened at INR 411.00 and touched an intraday high of INR 414.80 before slipping to a low of INR 403.30 during the session.
Tata Motors shares continued trading below their 52-week high of INR 509.00 recorded on February 27, 2026.
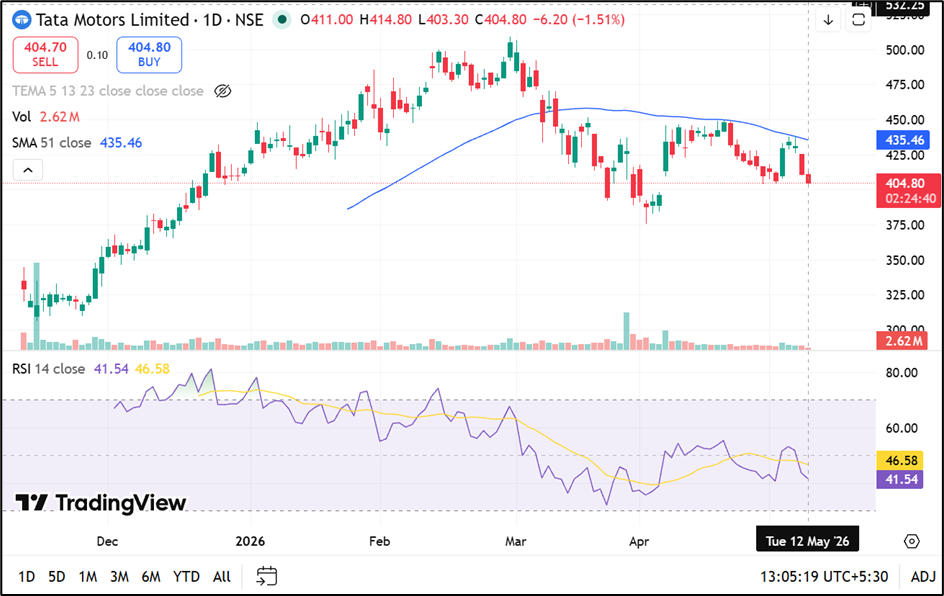
Source: TradingView
Trading Volumes and Market Capitalisation
The stock recorded traded volume of 26.00 lakh shares during the session, while traded value stood at INR 105.74 crore.
The company’s total market capitalisation stood at INR 1,49,281.71 crore, while free float market capitalisation was INR 84,447.59 crore. The stock’s VWAP during the session was INR 406.72.
Deliverable quantity as a percentage of traded quantity stood at 45.64%, while the impact cost remained low at 0.05.
Performance Compared With NIFTY NEXT 50
Tata Motors shares underperformed the NIFTY NEXT 50 index across several periods.
The stock declined 8.81% over one month, compared with a 2.42% rise in the benchmark index. On a year-to-date basis, Tata Motors shares fell 5.23%, while the benchmark index declined 0.57%.
However, over one week, the stock declined only 0.28%, compared with a 1.91% decline in the NIFTY NEXT 50 index.
The stock remained above its 52-week low of INR 306.30 recorded on November 14, 2025.
Valuation Indicator and Volatility
Exchange data indicated that Tata Motors’ PE ratio remained above 50 for the previous four trailing quarters.
The stock recorded annualised volatility of 35.15%, while daily volatility stood at 1.84.
The applicable margin rate stood at 15.18%, while the face value remained INR 2 per share.
According to the company profile, Tata Motors Commercial Vehicle Limited operates across small, medium, and heavy commercial vehicle segments.
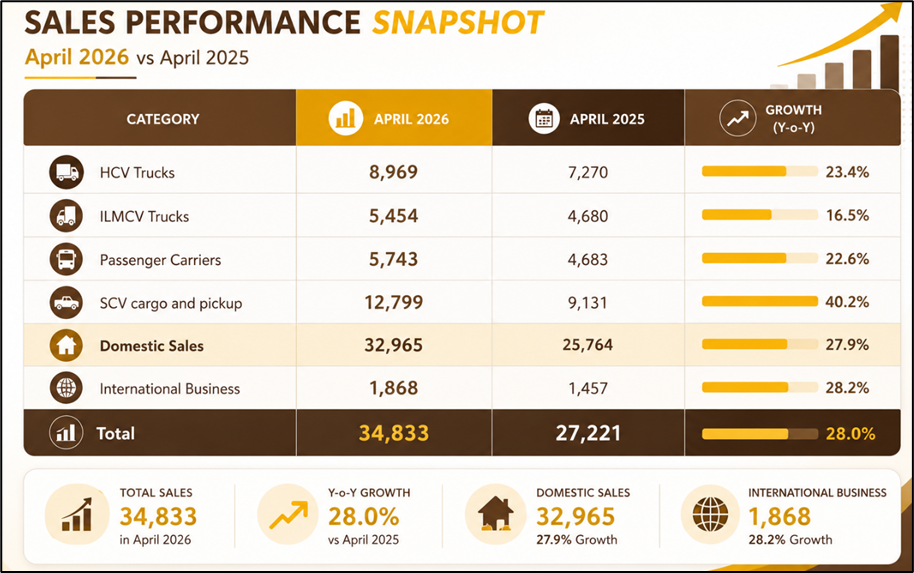
Source: Company Filing
Key Risks Investors Monitor
- Demand slowdown may affect commercial vehicle sales volumes.
- Rising raw material costs can impact operating margins.
- Competitive pricing pressure may influence profitability trends.
- Economic uncertainty could affect automobile sector demand.
Summary
Tata Motors (NSE:TMCV) shares declined more than 1% during Tuesday’s NSE trading session while continuing to trade below their 52-week high. The stock underperformed the NIFTY NEXT 50 across several periods, while investors monitored valuation indicators and automobile sector demand trends. Market participants also continue tracking raw material costs, competition, and broader economic conditions affecting vehicle sales.
FAQs
Q: What was Tata Motors share price on May 12, 2026?
A: Tata Motors shares traded at INR 405.40, down 1.36% during the NSE session.
Q: What is the 52-week high level of Tata Motors shares?
A: The stock’s 52-week high was INR 509.00, recorded on February 27, 2026.
Q: What valuation indicator was highlighted for Tata Motors stock?
A: Exchange data indicated the stock’s PE ratio exceeded 50 across four trailing quarters.