
Highlights
- Adani Ports handled 501 MMT cargo volume during FY26 across domestic and international operations.
- Revenue increased 25% YoY to INR 38,736 crore during the FY26 financial year.
- ADANIPORTS traded near its 52-week high amid continued logistics expansion activity.
Shares of Adani Ports and Special Economic Zone Limited (NSE:ADANIPORTS) traded higher on May 14, 2026.
The stock traded at INR 1,759.50 during intraday trade, up 1.25% from the previous close of INR 1,737.80. The stock opened at INR 1,761 and touched an intraday high of INR 1,778.10. Its 52-week high stands at INR 1,792, recorded on May 8, 2026.
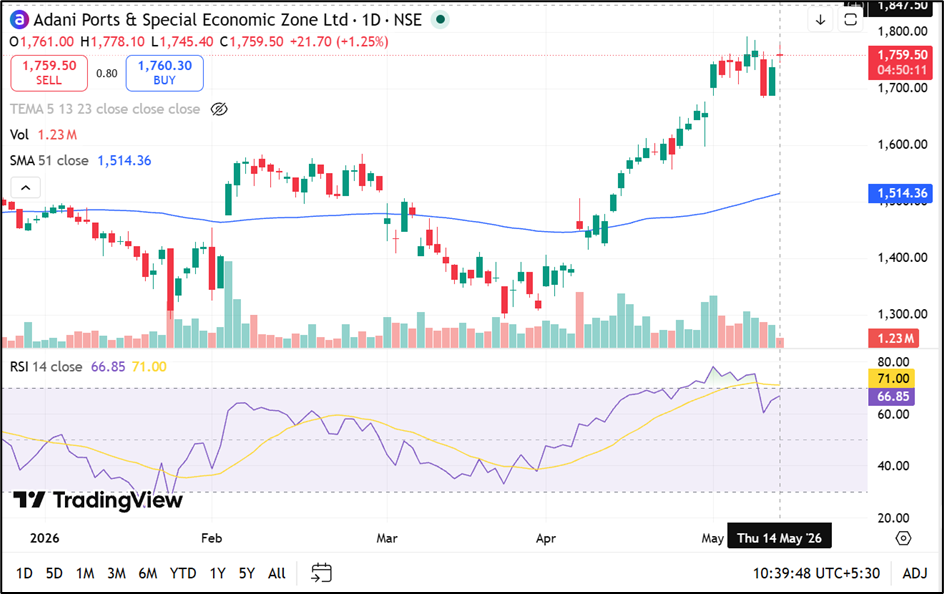
Source: Trading View
FY26 Revenue and Profit Rise
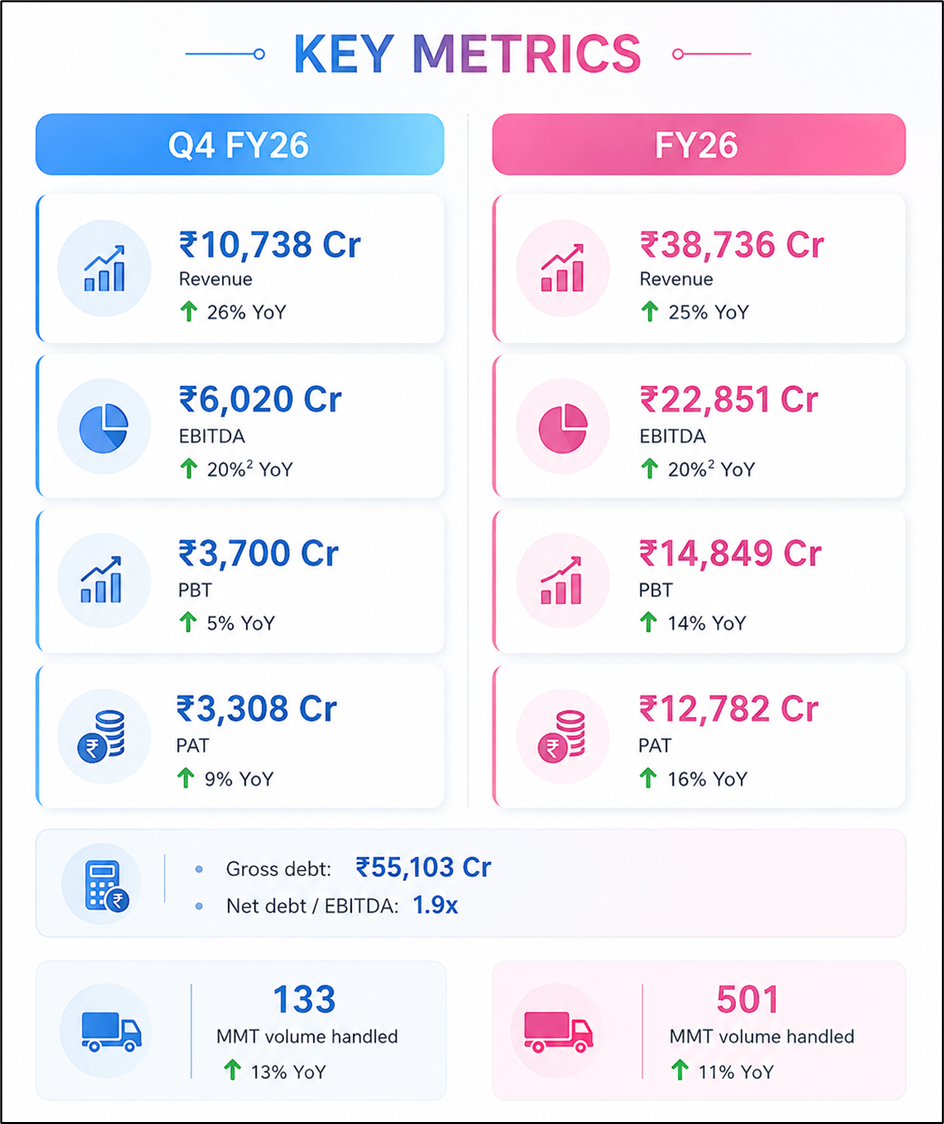
The company reported FY26 revenue of INR 38,736 crore, reflecting a 25% year-on-year increase. EBITDA for the year stood at INR 22,851 crore, up 20% YoY.
Profit before tax rose 14% YoY to INR 14,849 crore, while profit after tax increased 16% YoY to INR 12,782 crore.
For Q4 FY26, revenue came in at INR 10,738 crore, rising 26% YoY. Quarterly EBITDA stood at INR 6,020 crore, while quarterly PAT reached INR 3,308 crore.
The company reported gross debt of INR 55,103 crore, with net debt to EBITDA at 1.9x.
Cargo Volumes and Port Network Expand
Adani Ports handled 501 MMT cargo volume during FY26, representing 11% year-on-year growth. Q4 FY26 cargo handling volume stood at 133 MMT, up 13% YoY.
The company operates 15 domestic ports and terminals with a total handling capacity of 653 MMT. According to company disclosures, it accounts for 27.1% of India’s cargo market share and 45.5% of container market share.
Its international operations span four countries including Israel, Tanzania, Australia and Sri Lanka.
Source: Company Filing
Logistics and Marine Operations Remain Key Segments
The company’s logistics network remains connected to 95% of India’s hinterland through multi-modal logistics parks, warehouses and inland infrastructure assets across several Indian states.
Marine operations include a fleet of 136 vessels focused on the Middle East, Africa and South Asia region.
The stock has outperformed benchmark indices across longer periods. Over one year, ADANIPORTS delivered returns of 28.13%, compared with a 4.70% decline in the NIFTY 50 during the same period.
Key Risks
- High debt levels may increase financing and refinancing-related pressure.
- Global trade disruptions could affect cargo volumes across ports and logistics operations.
- Regulatory changes may influence port infrastructure and tariff-related operations.
- Elevated volatility may impact short-term stock price movement and investor sentiment.
Summary
Adani Ports traded (NSE:ADANIPORTS) near its 52-week high after reporting higher FY26 revenue, cargo volumes and profitability. The company handled 501 MMT cargo during the year while revenue rose 25% YoY to INR 38,736 crore. Investors also tracked the company’s logistics expansion, international operations and market share gains across India’s port and container handling sectors.
FAQs
Q: What was Adani Ports’ cargo volume during FY26?
A: The company handled 501 MMT cargo volume during FY26, reflecting 11% year-on-year growth.
Q: How much revenue did Adani Ports report in FY26?
A: Adani Ports reported FY26 revenue of INR 38,736 crore, up 25% from the previous year.
Q: What is the 52-week high of ADANIPORTS stock?
A: The stock’s 52-week high is INR 1,792, recorded on May 8, 2026.