
Highlights
- Airo Lam (NSE: AIROLAM) fell 3.88% and trading near ₹81.70.
- The stock continues to trade below its 50-day SMA of ₹89.75.
- Weak RSI and lower highs suggest the short-term trend remains under pressure.
Fundamental View
Airo Lam (NSE: AIROLAM) reported a modest December 2025 quarter. Consolidated total income stood at ₹6,993.65 lakh, while profit before tax came in at ₹186.26 lakh. Net profit was reported at ₹139.53 lakh, with earnings per share of ₹0.93.
The company remains profitable, but the earnings profile appears relatively soft compared with the weakness seen in the share price over the last few months. The stock has struggled to attract sustained interest despite the positive quarterly numbers.
Technical View
Airo Lam (NSE: AIROLAM) is currently trading near ₹81.70, down 3.88% in the session. The stock remains below its 50-day Simple Moving Average near ₹89.75, indicating that the broader structure continues to stay weak.
The chart reflects a steady downtrend since late January, with the stock forming lower highs and lower lows. Every rebound attempt has been capped near the falling moving average, suggesting that sellers remain active at higher levels.
The latest session also showed fresh weakness after the stock opened near ₹87.61 but slipped sharply toward ₹79.40 before recovering slightly. This pattern indicates that the stock is facing pressure whenever it approaches the recent trading range highs.
Momentum remains subdued as well. The RSI is near 37.57, which is below the neutral mark and points to weak near-term momentum.
Momentum Indicator
The stock is attempting to stabilise after the recent decline, but momentum remains fragile. Unless the price quickly moves back above the 50-day SMA, the overall tone may remain weak.
Key Technical Levels
The immediate downside zone is placed between ₹76.00 and ₹71.00. Holding above this region may help the stock avoid a deeper fall.
On the upside, Airo Lam (NSE: AIROLAM) may continue to face pressure between ₹87.00 and ₹94.00, where the falling moving average and previous swing highs are placed.
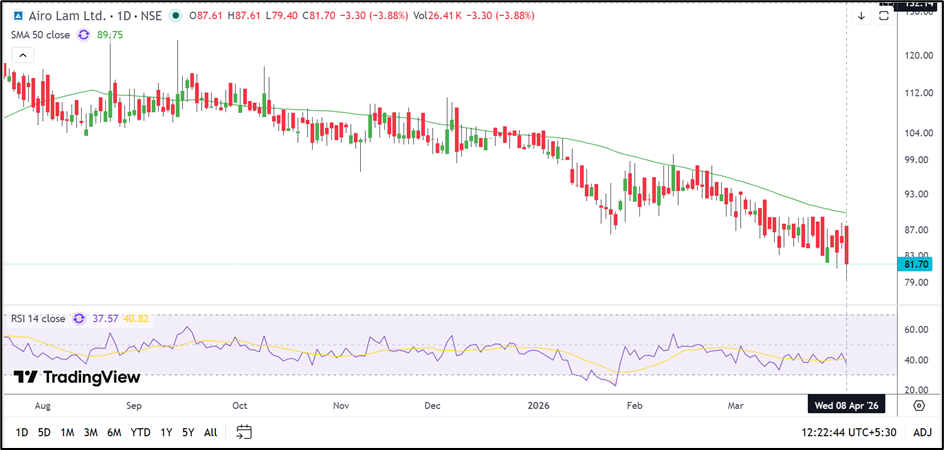
Source: TradingView
Key Risks
- The stock is trading below its 50-day SMA.
- Lower highs and lower lows continue to dominate the chart.
- RSI remains below 40.00, indicating weak momentum.
- A move below ₹76.00 may increase downside pressure.
Summary
Airo Lam (NSE: AIROLAM) continues to trade in a weak structure after extending its recent decline. The stock may need to reclaim levels above the 50-day average before the trend can improve.
FAQs
- Why did Airo Lam share price fall today?
The stock declined after failing to hold early gains and remained under pressure below its 50-day SMA. - Is Airo Lam trading above its 50-day SMA?
No, the stock is trading below its 50-day SMA of around ₹89.75. - What should traders watch next?
Traders may watch whether the stock can hold above ₹76.00 and whether it can recover back above the ₹87.00 area.