
Highlights
- Apollo Hospitals stock rose over 3% intraday while hovering near its 50-day average.
- Q3 FY26 revenue and profit increased, supported by growth across business segments.
- Technical indicators show moderate momentum, with resistance likely near ₹7,700–₹7,900.
Shares of Apollo Hospitals Enterprise Limited (NSE:APOLLOHOSP) gained around 3.07% to trade near ₹7,364.50 on March 24, 2026, on the National Stock Exchange (NSE). The stock is hovering close to its 50-day Simple Moving Average of ₹7,363.48, indicating a neutral near-term setup.
The price structure shows a recovery from recent lows following a prior corrective phase. However, the broader trend lacks clear direction, with recent price action reflecting consolidation rather than a sustained upward or downward move.
Sector Context and Business Presence
Apollo Hospitals operates across multiple healthcare segments, including hospitals, pharmacy, and digital health services. The company’s diversified presence allows it to capture demand across different healthcare verticals.
However, operational costs and expansion in digital healthcare platforms can influence margins, particularly during phases of growth and scaling.
Financial Performance Shows Growth Momentum
The company reported strong financial performance for Q3 FY26. Revenue increased 17% year-on-year to ₹64,774 million, driven by growth across all segments.
EBITDA rose 27% to ₹9,653 million, indicating improvement in operating performance. However, margins moderated due to higher costs associated with 24/7 operations and ESOP-related expenses.
Reported profit after tax (PAT) grew 35% to ₹5,023 million, reflecting overall operational momentum despite cost pressures in digital health and pharmacy segments.
Trading Activity Indicates Balanced Participation
The stock’s movement near its 50-day moving average suggests a balance between buying and selling interest. While there is some recovery from lower levels, the absence of a clear breakout indicates cautious participation.
Such consolidation phases often reflect indecision among market participants before a directional move emerges.
Technical Setup Shows Moderate Momentum
Apollo Hospitals Enterprise Limited is currently trading near ₹7,364.50 as of March 24, 2026, up around 3.07% for the session and hovering close to its 50-day Simple Moving Average near ₹7,363.48, indicating a neutral near-term setup. The price structure reflects a recovery from recent lows after a prior corrective phase, but the broader trend still lacks strong directional clarity.
Recent candles show volatility around the moving average, suggesting consolidation rather than a sustained move. The 14-day RSI stands near 45.04, indicating moderate momentum with slight improvement. On the downside, support is placed around ₹7,100–₹6,900, while resistance is seen near ₹7,700–₹7,900 in the near term.
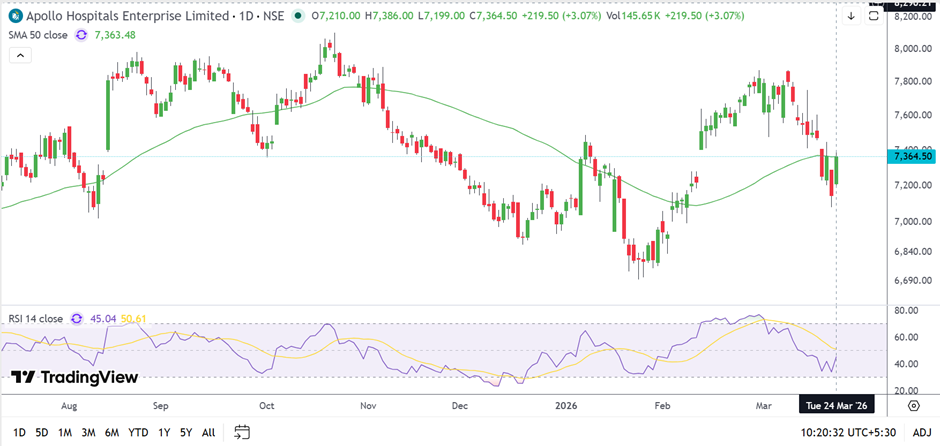
Source: TradingView
Outlook Depends on Breakout from Range
In the near term, the stock’s direction may depend on its ability to move decisively above resistance levels or hold support zones. While financial performance indicates growth, technical indicators suggest consolidation.
Market participants may continue to track margin trends and segment performance for further clarity.
Risk Factors to Monitor
- Margin moderation due to rising operational and ESOP-related costs.
- Consolidation near key levels indicates lack of strong directional momentum.
- Cost pressures in digital health and pharmacy segments may impact profitability.
Apollo Hospitals Enterprise Ltd (NSE:APOLLOHOSP) recent 3% gain reflects a recovery within a consolidation phase near key technical levels. While financial performance shows growth across segments, the absence of a clear trend and margin pressures suggest a balanced outlook. Sustained movement may depend on breakout confirmation and continued operational performance.
FAQs
- Why did Apollo Hospitals shares rise today?
The stock gained due to short-term recovery and buying interest near its 50-day moving average levels. - What are the key resistance levels for Apollo Hospitals stock?
The stock faces resistance between ₹7,700 and ₹7,900, which may limit near-term upside potential. - How did Apollo Hospitals perform in Q3 FY26?
The company reported growth in revenue, EBITDA, and profit, though margins were affected by higher operating and ESOP costs.