
Highlights
- Atul Auto Limited shares surged 15.06% to ₹501.20 in early trade on April 13, 2026.
- The stock vaulted above the ₹500.00 mark after reclaiming its 50-day SMA near ₹445.76.
- Strong quarterly earnings and a breakout from a multi-week base supported the sharp move.
Overview
Atul Auto Limited (NSE: ATULAUTO) climbed 15.06% to ₹501.20 on April 13, 2026, after opening at ₹450.00 and touching an intraday high of ₹504.80. The stock emerged among the top gainers of the session as buyers returned aggressively after several weeks of sideways movement.
The latest rally is significant because the stock had been trading in a broad declining pattern since February 2026. The move above ₹500.00 marks a clear change in short-term sentiment and indicates that the recent consolidation phase may be ending.
Fundamental View
Atul Auto reported strong consolidated earnings for the December 2025 quarter. The company posted total income of ₹23,140.00 lakh, while profit before tax came in at ₹2,002.00 lakh.
Net profit stood at ₹1,458.00 lakh and earnings per share was ₹5.52. The healthy profitability suggests that the company’s operating performance remained stable even during the recent weakness in the stock price.
Technical View
Atul Auto has delivered one of its strongest single-day moves in recent months, with the stock jumping from the ₹430.00–440.00 region to above ₹500.00 in one session. The move came after the stock spent several weeks building a base near the lower end of its recent range.
The stock has now decisively crossed above its 50-day Simple Moving Average near ₹445.76, which had capped previous recovery attempts. Unlike earlier rebounds that faded near the moving average, the current rise has been sharper and backed by a clear expansion in traded volumes.
The 14-day RSI has accelerated to 67.58, reflecting a strong pickup in momentum. However, the indicator is still below the extreme zone reached during the September 2025 rally, suggesting that the current upmove may still have room if participation remains strong.
Key Technical Levels
The stock may see near-term stability around ₹475.00–420.00 if some cooling emerges after the steep rise. If the current breakout continues to attract fresh participation, the next broad upside zone could gradually shift toward ₹550.00–600.00.
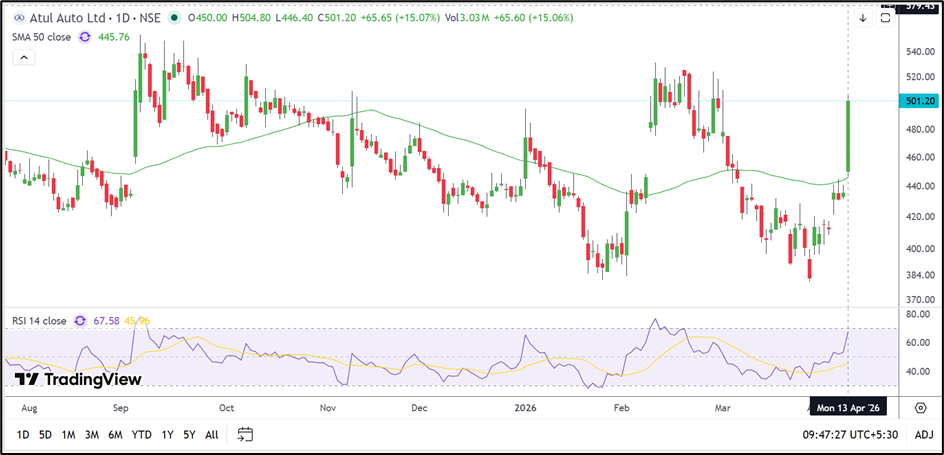
Source: TradingView
Risk to Watch
- The stock has risen sharply in a short period and may witness intermittent profit booking.
- Failure to hold above the recent breakout area could weaken the momentum.
- The broader auto sector remains sensitive to demand and input-cost trends.
- Any decline in trading volumes after the rally may slow the pace of the recovery.
Summary
Atul Auto appears to be entering a stronger phase after reclaiming the 50-day SMA and breaking out above a multi-week base. The sharp move is also supported by healthy quarterly profitability and stronger momentum readings. The next few sessions may indicate whether the stock can convert this rebound into a more sustained trend.
FAQs
Why did Atul Auto share price rise today?
The stock rose after a strong breakout above its recent trading range and 50-day SMA, supported by improved quarterly earnings and stronger momentum.
What is the 50-day SMA for Atul Auto?
The 50-day Simple Moving Average for Atul Auto is currently near ₹445.76.
How much net profit did Atul Auto report in December 2025?
Atul Auto reported a consolidated net profit of ₹1,458.00 lakh in the December 2025 quarter.