
Highlights
- Awfis Space Solutions shares declined over 7% during Thursday’s trading session.
- The stock slipped below its 21-day SMA, indicating weaker near-term price structure.
- RSI momentum cooled as investors tracked support zones after recent volatility.
Overview
Awfis Space Solutions (NSE: AWFIS) witnessed a notable correction on May 14, with the stock trading near INR 325.70, down 7.46% during the session. The decline followed recent volatility in the counter and brought the stock under investor focus as traders monitored whether key support zones can provide stability.
The stock had seen an upward move in recent weeks, but profit-booking and broader sentiment shifts appeared to weigh on near-term momentum.
Fundamental View
For the quarter ended December 2025, the company reported standalone total income of INR 34,884.70 lakh. Profit before tax stood at INR 1,910.30 lakh, while net profit came at INR 2,064.80 lakh. Earnings per share was reported at INR 2.67.
Awfis continues to operate in the flexible workspace segment, where growth expectations and occupancy trends remain important factors influencing sentiment.
Technical View
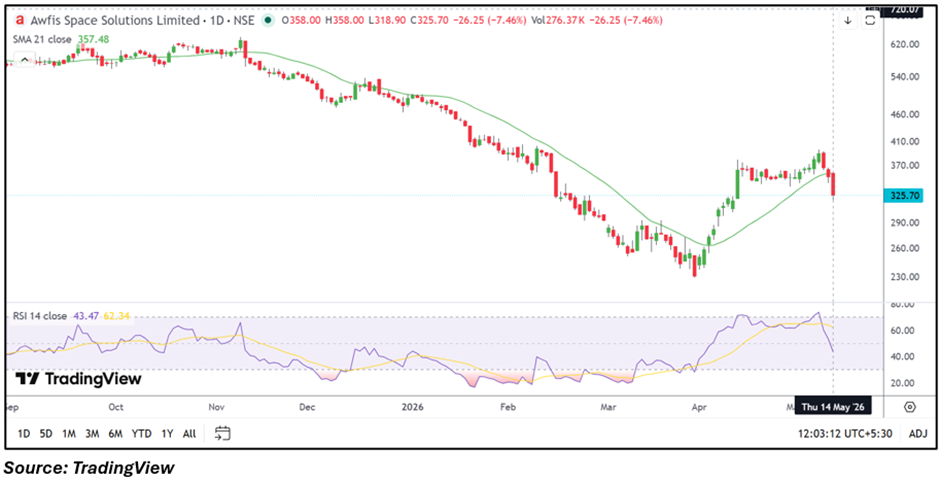
Awfis traded near INR 325.70 and declined 7.46% during the session. The stock moved below its 21-day SMA near INR 357.48, indicating a softer near-term structure. Price action reflects a sharp pullback after recent gains. The 14-day RSI slipped to around 43.47, suggesting momentum weakened following the correction. Immediate support is placed around INR 300–285, while resistance is expected near INR 345–360.
Momentum Indicator
The RSI near 43.47 moved below recent levels and indicates easing momentum. Market participants may watch whether the stock stabilizes around support zones.
Key Technical Levels
- Support: INR 300–285
- Resistance: INR 345–360
Risks to Watch
- Sharp volatility can impact near-term sentiment.
- Workspace demand trends may affect expectations.
- Price swings may remain elevated in the short term.
- Broader market weakness can influence momentum.
Summary
Awfis shares witnessed a sharp correction and slipped below key moving average levels during the session. Investors may closely watch support levels and momentum indicators for signs of stabilization after the recent decline.
FAQs
Why did Awfis shares fall today?
The stock saw selling pressure amid volatility and weakening near-term momentum.
What are the immediate support levels for Awfis?
Immediate support is placed near INR 300–285.
What does the RSI indicate?
RSI near 43.47 suggests momentum softened after the recent correction.