
Highlights
- Axita Cotton Ltd (NSE: AXITA) declined 9.93% to ₹8.16 after slipping steadily through the session.
- The stock has moved below its 21-day SMA of ₹8.78, indicating that short-term momentum has weakened.
- Axita Cotton reported standalone net profit of ₹259.58 lakh for the December 2025 quarter.
Overview
Axita Cotton Ltd (NSE: AXITA) fell 9.93% to ₹8.16 after opening at ₹8.91 and touching an intraday high of ₹9.10. The stock remained under pressure throughout the session and finally closed near the day’s low.
The decline comes after several weeks of sideways movement in the ₹8.70–9.10 zone. The latest drop has pushed the stock below this range and erased much of the recovery seen earlier in April.
Fundamental View
For the quarter ended December 2025, Axita Cotton reported standalone total income of ₹8,963.47 lakh.
Profit before tax stood at ₹428.02 lakh, while net profit came in at ₹259.58 lakh. Earnings per share was ₹0.07.
The company remains profitable, although the modest earnings profile suggests that the recent price action is being driven more by market sentiment and technical weakness.
Technical View
Axita Cotton is now trading below its 21-day Simple Moving Average of ₹8.78, which indicates that the near-term structure has turned weaker.
The stock had been holding near the ₹8.80–9.00 area for several sessions, but the latest sell-off pushed it beneath that zone. This breakdown suggests that the recent consolidation phase has shifted into a softer trend.
The 14-day RSI has dropped to 35.47, reflecting fading momentum and indicating that the stock is moving closer to oversold territory. However, the RSI is still above extreme levels, which means further downside cannot be ruled out if selling pressure continues.
Key Technical Levels
The ₹7.65–7.25 region may now act as the next important support area. If the stock continues to remain below ₹8.00, this lower band could come into focus over the coming sessions.
On the upside, the first recovery hurdle is likely to emerge around ₹8.80–9.20. Unless Axita Cotton moves back above this region, the near-term trend may remain under pressure.
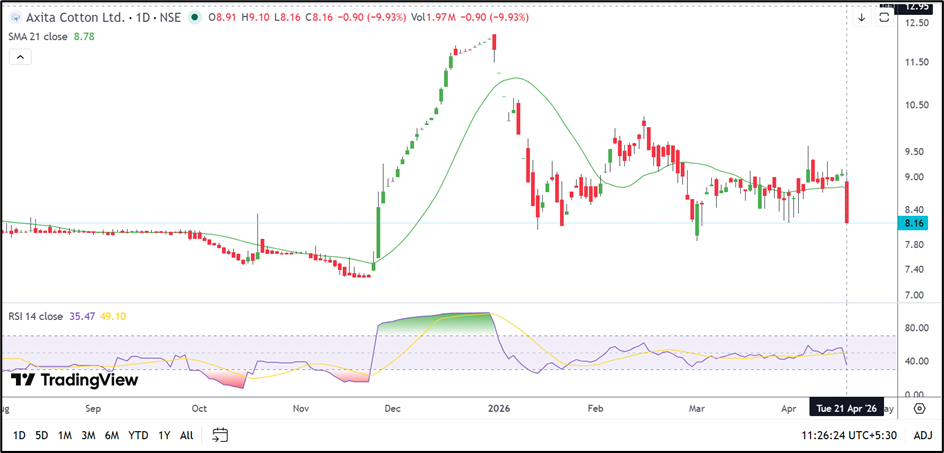
Source: TradingView
Risks to Watch
- The stock has slipped below its 21-day SMA, weakening the recent trading structure.
- Continued weakness below ₹8.00 may increase the chances of a move toward the lower support band.
- The stock has been highly volatile in recent months, which can lead to sharp price swings.
- Although the company remains profitable, the market may continue to focus on the weak chart setup.
Summary
Axita Cotton Ltd (NSE: AXITA) has lost momentum after failing to hold above its recent trading range. The stock is now trading below its 21-day SMA and the short-term structure has turned softer.
While the company remains profitable at the operational level, the technical picture has weakened considerably. A move back above ₹8.80–9.20 may be needed before the stock can show signs of stabilisation.
FAQs
Why did Axita Cotton share price fall today?
The stock declined sharply after failing to hold above the recent ₹8.80–9.00 range and witnessing continued selling pressure.
Is Axita Cotton trading below its 21-day SMA?
Yes. Axita Cotton is trading below its 21-day SMA of ₹8.78.
What are the next key levels for Axita Cotton?
The stock may find support near ₹7.65–7.25, while resistance is likely around ₹8.80–9.20.