
Highlights
- Bafna Pharmaceuticals shares declined 5% and hit the lower circuit on June 15.
- The stock is witnessing profit booking after a sharp rally in recent sessions.
- Despite the decline, the share price continues to trade above its 50-day SMA.
Overview
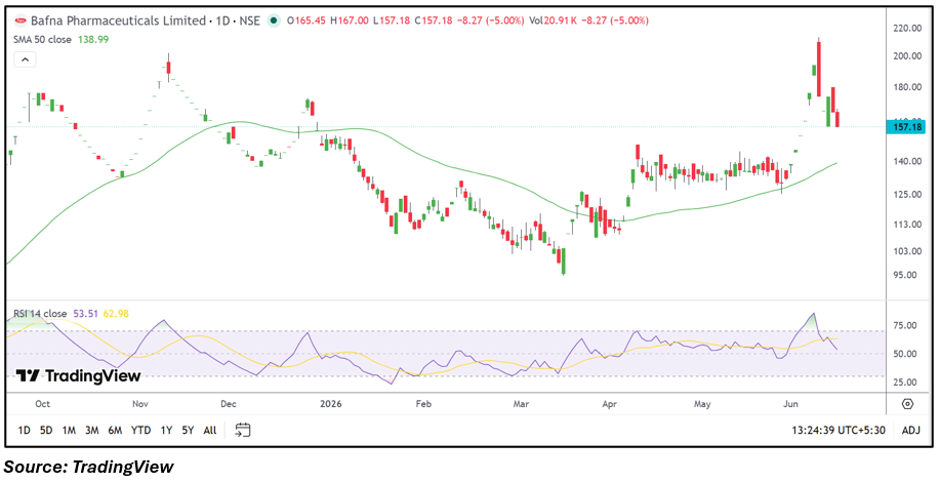
Bafna Pharmaceuticals (NSE: BAFNAPH) remained under pressure on June 15, 2026, with the stock falling 5.00% to ₹157.18 and hitting its lower circuit limit. The decline follows a sharp upward move seen in recent sessions, suggesting that traders may be locking in gains after the stock's rapid advance.
The stock opened at ₹165.45 and slipped to an intraday low of ₹157.18. Trading activity remained elevated as market participants reassessed short-term valuations following the recent rally.
Fundamental View
For the quarter ended March 2026, Bafna Pharmaceuticals reported standalone total income of INR 4,400.09 lakh. Profit before tax stood at INR 261.95 lakh, while net profit came in at INR 274.91 lakh. Earnings per share for the quarter was reported at INR 1.16.
The latest financial performance indicates profitability, although investors may continue to monitor earnings consistency, product demand trends, regulatory developments, and margin performance in upcoming quarters.
Technical View
BAFNAPH is currently trading at ₹157.18 after declining 5.00% during the session. Despite the sharp correction, the stock remains above its 50-day SMA of ₹138.99, indicating that the broader medium-term structure has not yet been invalidated.
The chart shows a steep rally toward the ₹200 zone earlier this month before profit booking emerged. The recent decline has pulled the RSI lower from overbought territory, reflecting a cooling of momentum after the sharp run-up. As long as the stock remains above the 50-day SMA, traders may continue to watch whether the current weakness stabilizes or develops into a deeper correction.
Momentum Indicator
The 14-day RSI stands near 53.51, remaining above the neutral 50 mark despite the recent selloff. This suggests that momentum has moderated from elevated levels but has not completely weakened.
Key Technical Levels
From the current price of ₹157.18, immediate support is placed near ₹149.32, followed by another support zone around ₹141.46. On the upside, resistance may emerge near ₹165.04, while a stronger hurdle is positioned around ₹172.90. The stock's reaction around these zones could provide clues regarding the sustainability of the current correction.
Risks to Watch
- Continued profit booking after the recent rally.
- Low trading participation and liquidity concerns.
- Regulatory developments affecting the pharmaceutical sector.
- Volatility associated with the BE surveillance segment.
Summary
Bafna Pharmaceuticals shares fell 5% on June 15 as profit booking continued after a sharp rally in previous sessions. While the correction has weakened near-term momentum, the stock still trades above its 50-day SMA, suggesting the broader recovery structure remains intact. Investors are likely to watch whether support zones hold and whether the stock can stabilize after the recent bout of selling pressure.
FAQs
- Why did Bafna Pharmaceuticals fall 5% today?
The stock witnessed profit booking after a sharp rally and hit the lower circuit limit.
- Is BAFNAPH still above its 50-day SMA?
Yes, the stock remains above its 50-day SMA of ₹138.99 despite the recent correction.
- Does today's decline confirm a trend reversal?
Not necessarily. The stock remains above key medium-term trend references, although near-term momentum has weakened.