
Highlights
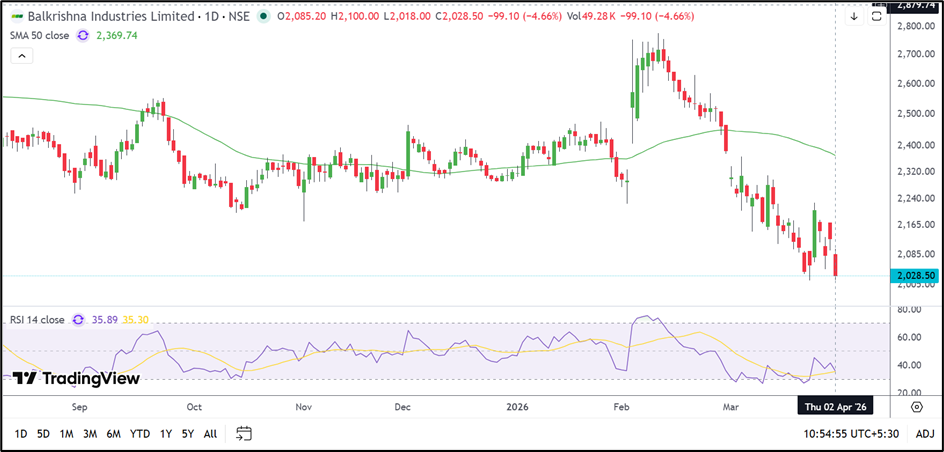
- Balkrishna Industries Limited (NSE: BALKRISIND) declined 4.66% to INR 2,028.40 on 2 April 2026.
- The stock has slipped below its 50-day Simple Moving Average near INR 2,369.74.
- December 2025 quarter net profit stood at INR 37,498.00 lakh.
Balkrishna Industries Limited (NSE: BALKRISIND) traded sharply lower on Thursday, falling 4.66% to INR 2,028.40. The stock opened at INR 2,085.20 and moved between an intraday high of INR 2,100.00 and a low of INR 2,018.00. VWAP for the session stood at INR 2,040.95.
The latest decline came after the stock failed to stabilise following its February peak. Since then, Balkrishna Industries Limited (NSE: BALKRISIND) has remained in a sustained corrective phase, with price action continuing to form lower highs and lower lows.
Fundamental View
For the quarter ended 31 December 2025, Balkrishna Industries Limited (NSE: BALKRISIND) reported standalone total income of INR 2,80,644.00 lakh. Profit before tax stood at INR 48,339.00 lakh, while net profit came in at INR 37,498.00 lakh. Earnings per share for the quarter was INR 19.40.
The company continues to report healthy profitability, although the recent weakness in the share price suggests that the market is focusing more on the near-term slowdown in momentum.
Technical View
Balkrishna Industries Limited (NSE: BALKRISIND) is currently trading near INR 2,028.40 and remains well below its 50-day Simple Moving Average near INR 2,369.74. The gap between the stock price and the moving average indicates that the broader trend has weakened considerably.
The chart shows that the stock entered a strong downtrend after failing to hold above the INR 2,700.00 zone earlier this year. Since then, every short-term rebound has been followed by another decline, keeping the overall structure under pressure.
The latest move below INR 2,050.00 suggests that the stock is again approaching an important support region. The 14-day RSI stands near 35.89, showing that momentum remains weak and is still below the neutral 50 mark.
Unless Balkrishna Industries Limited (NSE: BALKRISIND) manages to move back above the INR 2,150.00 region, the recent rebound attempts may continue to fade.
Key Technical Levels
Immediate support is placed near INR 1,906.00, followed by a lower zone around INR 1,850.00. On the upside, the stock may face resistance near INR 2,150.00 and then around INR 2,300.00.
Source: TradingView
Risks To Watch
- Continued weakness below INR 2,000.00 may deepen the correction.
- Resistance near INR 2,150.00–2,300.00 may limit recovery attempts.
- Momentum remains weak as RSI stays below 50.
- The stock continues to trade below its 50-day moving average.
Summary
Balkrishna Industries Limited (NSE: BALKRISIND) declined 4.66% to INR 2,028.40 and continues to remain in a weak corrective structure below its 50-day moving average near INR 2,369.74. RSI near 35.89 suggests that momentum remains subdued, while the stock may continue to stay under pressure unless it reclaims the INR 2,150.00 zone.