
Highlights
- Brooks Laboratories (NSE: BROOKS) surged 12.26% in Thursday’s session.
- December quarter consolidated net profit stood at INR 549.88 lakh.
- The stock rebounded after recovering from a fresh low near INR 40.00.
Brooks Laboratories (NSE: BROOKS) traded sharply higher on 2 April 2026, with the stock moving near INR 49.99, up 12.26% from its previous close of INR 44.53. The stock opened at INR 45.86 and touched an intraday high of INR 51.80, while the day’s low stood at INR 45.21. VWAP for the session was recorded at INR 49.34.
The latest move placed Brooks Laboratories (NSE: BROOKS) among the top gainers of the day. Even so, the stock continues to remain under ASM-1 surveillance.
Fundamental View: December Quarter Profit Remains Positive
For the quarter ended 31 December 2025, Brooks Laboratories (NSE: BROOKS) reported consolidated total income of INR 1,669.13 lakh. Profit before tax stood at INR 30.28 lakh, while net profit came in at INR 549.88 lakh. Earnings per share for the quarter was reported at INR 1.87.
The latest financial performance indicates that the company remained profitable during the quarter, although the share price continues to reflect elevated volatility.
Technical View: Recovery Attempt Emerges From Lower End Of Range
Brooks Laboratories (NSE: BROOKS) is currently trading near INR 49.99 and remains below its 50-day Simple Moving Average near INR 62.32. The broader structure still reflects a weak trend, as the stock continues to trade below the 50-day average and below earlier swing levels.
However, the recent rebound from the INR 38.00–40.00 area suggests that downside pressure has eased in the near term. The stock has moved back above INR 45.00, while the 14-day RSI has improved to around 42.78 after recovering from weaker levels.
Even so, the RSI remains below the neutral 50 mark, indicating that the recovery is still at an early stage. Unless Brooks Laboratories (NSE: BROOKS) moves above the INR 55.00 zone, the recent rise may continue to be viewed as a rebound within a broader correction.
Key Technical Levels
At INR 49.99, immediate support is seen near INR 45.00, followed by stronger downside support around INR 41.00. On the upside, resistance is placed near INR 55.00–60.00.
A move above INR 55.00 could support further recovery toward INR 60.00, while failure to hold above INR 45.00 may bring the recent low zone back into focus.
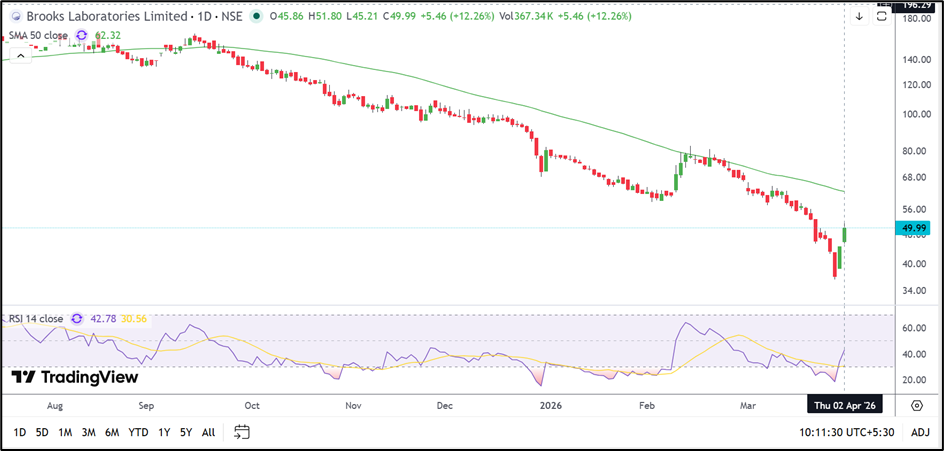
Source: TradingView
Key Risks
- Failure to hold above INR 45.00 may weaken the rebound.
- Resistance near INR 55.00–60.00 may restrict recovery.
- ASM-1 surveillance may keep volatility elevated.
- The stock remains below its 50-day moving average.
Summary
Brooks Laboratories (NSE: BROOKS) rose 12.26% to INR 49.99 after rebounding from recent lows. The stock remains below its 50-day moving average near INR 62.32, while RSI near 42.78 indicates that momentum is improving but still remains below neutral.
FAQs
- Why did Brooks Laboratories shares rise today?
The stock rebounded after recovering from a recent low near INR 40.00. - What was Brooks Laboratories’ December quarter net profit?
The company reported consolidated net profit of INR 549.88 lakh. - Which levels are important for Brooks Laboratories shares?
Support is near INR 45.00–41.00, while resistance is around INR 55.00–60.00.