
Highlights
- Cambridge Technology Enterprises (NSE: CTE) gained 6.17% to INR 28.73.
- The stock is attempting a rebound near its 50-day SMA of INR 29.60.
- December 2025 quarter net profit stood at INR 108.53 lakh.
Cambridge Technology Enterprises (NSE: CTE) witnessed a strong rebound on 7 April 2026, with the stock rising 6.17% to INR 28.73. The share opened at INR 27.77 and moved steadily higher during the session, touching an intraday high of INR 29.25. The stock remained above its low of INR 27.34 through the day, while VWAP stood at INR 28.11.
The latest move has improved near-term sentiment after the stock spent several weeks under pressure. Cambridge Technology Enterprises (NSE: CTE) is now attempting to reclaim its 50-day Simple Moving Average near INR 29.60, which could become an important turning point for the stock.
Fundamental View
For the quarter ended 31 December 2025, Cambridge Technology Enterprises (NSE: CTE) reported standalone total income of INR 1,434.96 lakh. Profit before tax came in at INR 145.20 lakh, while net profit stood at INR 108.53 lakh. Earnings per share for the quarter was INR 0.55.
The latest quarterly numbers show that the company has remained profitable despite recent weakness in the share price. Improving profitability may support sentiment if the stock is able to maintain the current rebound.
Technical View
Cambridge Technology Enterprises (NSE: CTE) is currently trading near INR 28.73 and is approaching its 50-day Simple Moving Average around INR 29.60. The chart suggests that the stock has started to rebound after finding support near the INR 21.50–24.00 zone.
The recent move above INR 27.00 has strengthened the short-term structure. The stock has also formed a sequence of higher lows over the last few sessions, indicating that buying interest is returning.
The 14-day RSI has improved to around 58.59 and is now above its signal line near 36.26. This indicates that momentum has turned positive after remaining weak through much of March.
However, the stock is now approaching an important resistance area near INR 31.50. Since the 50-day moving average is still above the current price, Cambridge Technology Enterprises (NSE: CTE) may face some pressure near higher levels.
A sustained move above INR 31.50 could strengthen the rebound further and open the possibility of a move toward INR 34.00.
Key Technical Levels
Immediate support is placed near INR 27.00. If the stock slips below this level, the next important support zone is around INR 25.00.
On the upside, the first resistance is near INR 31.50. A stronger hurdle remains near INR 34.00.
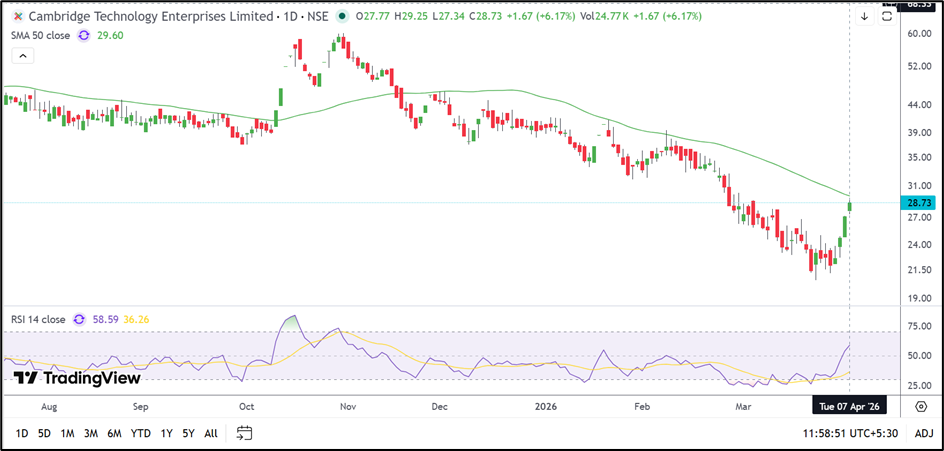
Source: TradingView
Risks To Watch
- Failure to move above INR 31.50 may slow the rebound.
- The stock is still trading below its 50-day moving average.
- A break below INR 27.00 could weaken the near-term structure.
- Low trading participation may increase volatility.
FAQs
- Why did Cambridge Technology Enterprises (NSE: CTE) rise today?
The stock rebounded after holding support near INR 27.00 and improved momentum pushed it higher. - What was Cambridge Technology Enterprises’ December 2025 net profit?
The company reported standalone net profit of INR 108.53 lakh. - What are the important support and resistance levels?
Support is placed near INR 27.00–25.00, while resistance remains near INR 31.50–34.00.