
Highlights
- GTL shares climbed 15.98% during Wednesday’s trading session.
- December quarter net loss stood at INR 262.92 lakh.
- Investors tracked the stock after a rebound from recent lows.
GTL Limited (NSE: GTL) moved sharply higher on 1 April 2026, with the stock trading near INR 5.88, up 15.98% from its previous close of INR 5.07. The stock opened at INR 5.40 and touched an intraday high of INR 5.94, while the day’s low stood at INR 5.31. VWAP for the session was recorded at INR 5.68.
The latest move placed GTL among the session’s top gainers after the stock rebounded from a recent low near INR 5.00. Even so, the stock continues to trade in the GSM-0 category, while earnings based on the previous four trailing quarters remain at zero.
Fundamental View: December Quarter Loss Remains In Focus
For the quarter ended 31 December 2025, GTL reported standalone total income of INR 5,521.93 lakh. The company reported a loss before tax of INR 262.92 lakh, while net loss also stood at INR 262.92 lakh. Earnings per share for the quarter was reported at negative INR 0.17.
The latest financial performance indicates that the company remained under pressure during the quarter despite the recent rise in the share price. Investors appear to have revisited the stock after the sharp rebound from recent lows, although earnings visibility remains limited.
Technical View: Recovery Attempt After Recent Decline
GTL is currently trading near INR 5.88 and remains below its 50-day Simple Moving Average near INR 6.98, indicating that the broader price structure continues to stay weak. The recent price action suggests the stock is attempting to rebound after falling to a recent low near INR 4.90.
The latest move has helped the stock recover from the lower end of its recent range. However, price action remains below the earlier swing zone near INR 6.80–8.00, indicating that the broader trend has not yet improved.
Momentum Indicator Moves Higher from Weak Levels
The 14-day RSI has improved to around 39.65 after slipping below 30 in recent sessions. This indicates that momentum has recovered from deeply weak levels, although it remains below the neutral 50 mark.
Key Technical Levels
At INR 5.88, immediate support is now seen near INR 5.27, followed by stronger downside support around INR 4.65. On the upside, resistance is placed near INR 6.80–8.00.
A move above INR 6.80 may improve the near-term recovery outlook, while failure to hold above INR 5.27 could keep the stock under pressure.
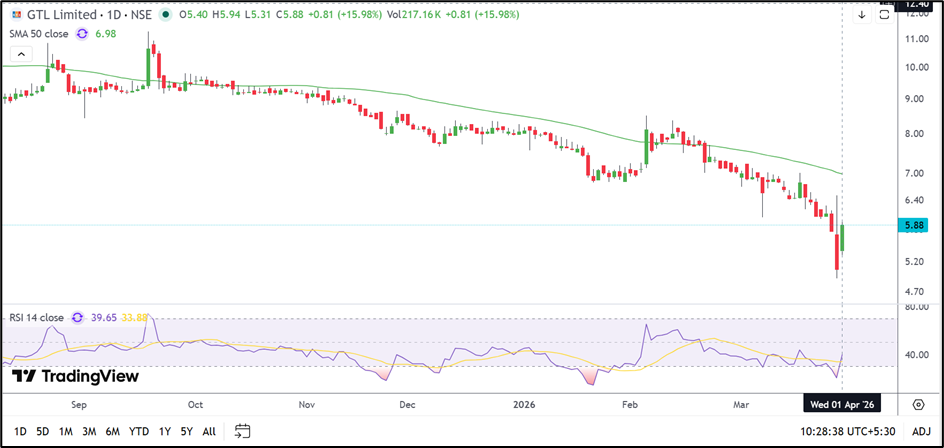
Source: TradingView
Key Risks
- Continued quarterly losses may affect investor sentiment.
- Failure to hold above INR 5.27 may weaken the rebound.
- Resistance near INR 6.80–8.00 could restrict further recovery.
- GSM category classification may keep volatility elevated.
Summary
GTL shares rose 15.98% to INR 5.88 after rebounding from recent lows near INR 5.00. However, the stock remains below its 50-day moving average near INR 6.98, while December quarter net loss stood at INR 262.92 lakh. RSI has improved from weak levels, but investors are likely to monitor whether GTL can sustain the rebound above INR 5.27 and move toward INR 6.80.
FAQs
- Why did GTL shares rise nearly 16% today?
The stock rebounded from recent lows and attracted renewed trading interest. - What was GTL’s December quarter net loss?
The company reported a standalone net loss of INR 262.92 lakh. - Which levels are important for GTL shares now?
Support is near INR 5.27–4.65, while resistance stands near INR 6.80–8.00.