
Highlights
- The stock has surged nearly 20% and moved above its 50-day SMA.
- RSI indicates overbought conditions, suggesting stretched momentum after recent rally.
- Resistance levels ahead may trigger consolidation following the sharp upward move.
Pearl Polymers Limited (NSE:PEARLPOLY) is trading near INR 21.39, reflecting a gain of around 19.97% in the latest session. The stock has moved decisively above its 50-day simple moving average at INR 17.56, indicating a shift from a prior downtrend toward a potential recovery phase. The recent spike has taken prices to the upper band level of INR 21.39 during intraday trade.
The rebound comes after the stock touched its 52-week low of INR 12.75 in March 2026. However, the sharp upward movement suggests that near-term consolidation or minor pullback may occur. Immediate support is placed in the INR 18.00–16.00 zone, while resistance is seen between INR 23.00 and INR 26.00.
Momentum Indicators Point to Overbought Zone
The 14-day Relative Strength Index (RSI) is positioned near 73.44, indicating overbought conditions and stretched momentum in the short term. While this reflects strong buying activity, it also suggests the possibility of cooling off or sideways movement.
The intraday range between INR 17.41 and INR 21.39 highlights notable volatility.
The VWAP at INR 20.34 indicates that current trading levels remain above average traded prices, supporting the recent upward bias. Daily volatility stands at 3.39, while annualised volatility is elevated at 64.77, pointing to significant price fluctuations.
Returns Show Short-Term Outperformance
Pearl Polymers has delivered strong short-term returns, rising 27.25% over the past week compared to 0.92% in NIFTY 50. On a one-month basis, the stock gained 28.62%, outperforming the broader index.
However, longer-term returns remain under pressure. The stock has declined 26.72% over the past year and 8.55% on a year-to-date basis, compared to relatively stable index performance. Over three and five years, returns stand at 4.34% and 25.09%, trailing benchmark gains.
Financial Performance Reflects Losses
For the quarter ended December 2025, standalone total income stood at INR 465.12 lakh. The company reported a loss before tax of INR 164.26 lakh, with net loss at the same level. Earnings per share came in at negative INR 0.98.
These figures indicate that despite recent price recovery, the financial performance remains under pressure, with losses continuing in the latest reported quarter.
Trading Activity and Liquidity Trends
The stock recorded traded volume of 1.11 lakh shares, translating into a traded value of INR 0.23 crore. The total market capitalisation stands at INR 36.01 crore, with free float market cap at INR 16.00 crore.
The impact cost of 2.29 suggests relatively lower liquidity, which can amplify price swings. Deliverable quantity stands at 69.80%, indicating a higher proportion of delivery-based trades.
Technical Summary
Pearl Polymers Limited is trading near ₹21.39, up around 19.97%, and has moved decisively above the 51-day SMA near ₹17.56, with the 14-day RSI near 73.44 indicates overbought conditions, pointing to stretched momentum in the short term. Immediate support is placed in the ₹18.00–16.00 zone, while resistance is seen near the ₹23.00–26.00 range.
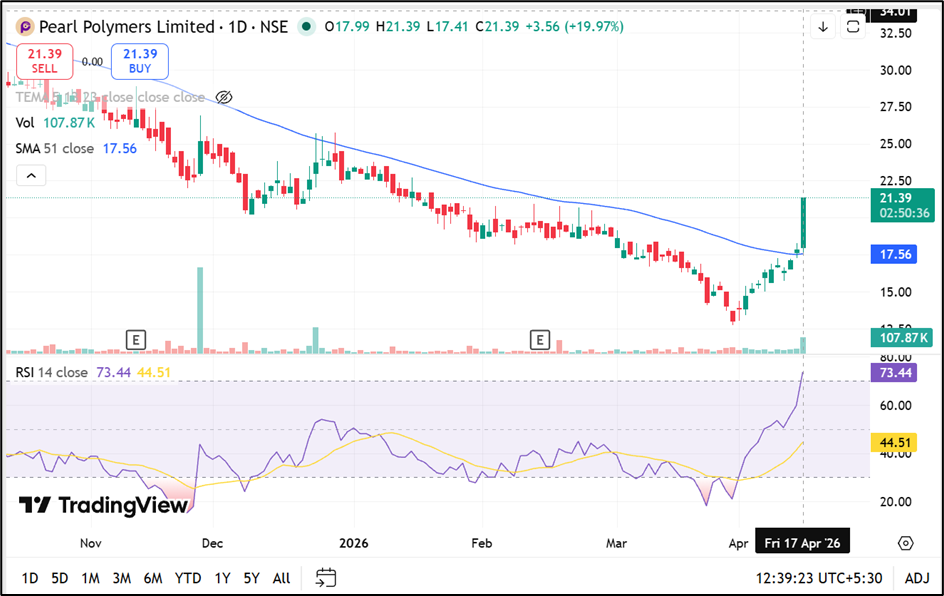
Source: TradingView
Key Risks to Monitor
- Overbought RSI may lead to short-term correction or sideways movement.
- Low liquidity and high impact cost can increase volatility risk.
- Continued financial losses may weigh on long-term sentiment.
- Resistance zone near INR 23–26 could cap near-term upside.
Summary
Pearl Polymers Limited has witnessed a sharp rally, moving above its 50-day SMA and indicating a potential recovery phase. However, overbought momentum and resistance levels ahead suggest that the stock may consolidate in the near term. While short-term returns have been strong, longer-term performance and recent financial losses remain key factors to monitor.
Frequently Asked Questions (FAQs)
What does the breakout above the 50-day SMA indicate?
It signals a possible trend reversal, suggesting recovery after a sustained period of price decline.
Why is RSI above 70 important for the stock?
It indicates overbought conditions, meaning the stock may see consolidation or short-term correction.
What are the key support and resistance levels?
Support is placed at INR 18–16, while resistance is observed between INR 23 and INR 26.