
Highlights
- PPAP Automotive shares surged over 15% and featured among the day's top gainers.
- Strong FY26 earnings supported investor interest in the stock.
- The stock moved decisively above its 50-day SMA with improving momentum.
Overview
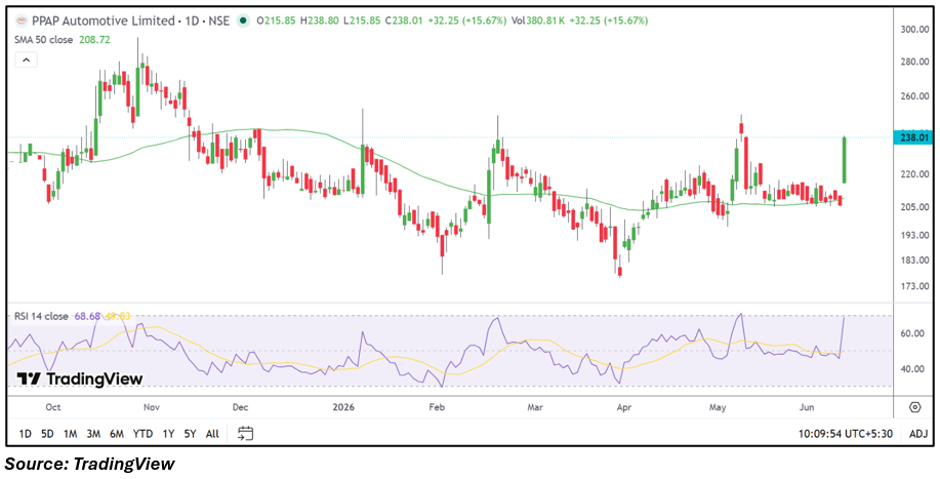
PPAP Automotive (NSE: PPAP) attracted significant market attention after its shares jumped more than 15% to around ₹238.01. The stock touched an intraday high of ₹238.80 and emerged among the top gainers on the NSE. The sharp move follows strong financial performance and a notable improvement in the stock's technical setup.
Investors are now evaluating whether the latest rally can be sustained after the stock broke out of its recent trading range.
Fundamental View
PPAP Automotive reported solid financial performance for the quarter ended March 2026. The company posted total income of INR 17,508.09 lakh, profit before tax of INR 5,330.55 lakh, and net profit of INR 4,544.51 lakh. Earnings per share stood at INR 32.20.
The earnings performance reflects a significant improvement in profitability and remains one of the key factors supporting the recent rise in the share price. Investors will continue to monitor demand trends in the automotive sector and the company's ability to maintain earnings momentum in the coming quarters.
Technical View
PPAP Automotive is trading near ₹238.01, well above its 50-day SMA of ₹208.72. The stock witnessed a sharp breakout after spending several weeks consolidating around the moving average. The current price structure indicates renewed upward momentum, while RSI has climbed to 68.68, approaching the overbought zone. The ability to maintain levels above the 50-day SMA may remain important for sustaining the ongoing recovery.
Momentum Indicator
The 14-day RSI stands at 68.68, reflecting strong positive momentum. While the indicator remains below the 70 overbought threshold, traders may watch for further momentum confirmation following the sharp price move.
Key Technical Levels
PPAP Automotive is currently trading around ₹238.01 after breaking above recent consolidation levels and extending gains beyond its 50-day SMA at ₹208.72. Immediate support is seen in the ₹220.00–₹215.00 zone, while the 50-day SMA around ₹208.72 remains an important medium-term support area. On the upside, the stock has tested ₹238.80, and a sustained move above this level could keep focus on the ₹250.00–₹260.00 region.
Key Risks to Watch
- Slowdown in automotive sector demand.
- Margin pressure from raw material costs.
- Profit booking after a sharp rally.
- Earnings growth moderation in future quarters.
Summary
PPAP Automotive entered the top gainers list after a sharp rally supported by strong FY26 earnings and improving technical momentum. The stock is trading above its 50-day SMA and nearing an important resistance zone. While the near-term trend has strengthened, investors may continue watching earnings consistency, sector demand conditions, and the stock's ability to hold above recently reclaimed support levels.
FAQs
- Why did PPAP Automotive shares rise sharply today?
Strong earnings performance and an improvement in technical momentum helped drive the stock higher. - Is PPAP Automotive trading above its 50-day SMA?
Yes, the stock is trading above its 50-day SMA of ₹208.72, indicating improved trend strength. - What are the key risks investors should monitor?
Investors should watch automotive demand trends, margins, earnings sustainability, and potential profit booking.