
Highlights
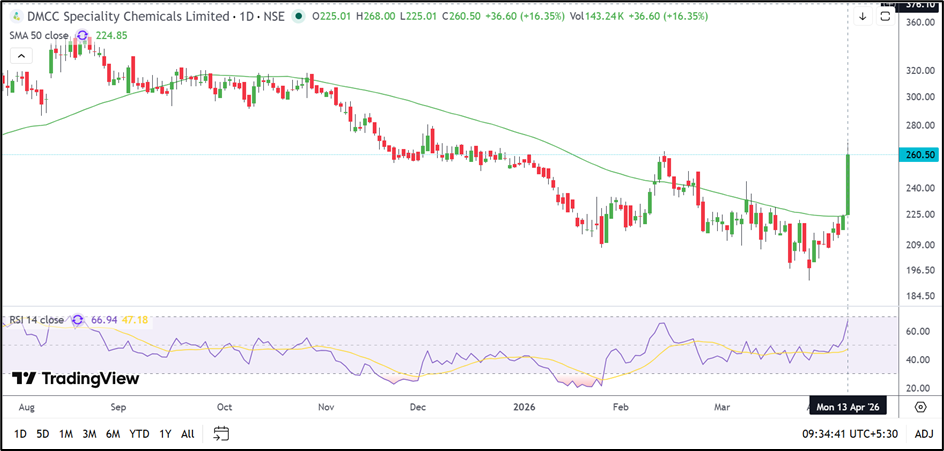
- DMCC Speciality Chemicals Limited shares climbed 16.35% to ₹260.50 in early trade on April 13, 2026.
- The stock moved sharply above its 50-day SMA near ₹224.85 after a prolonged consolidation phase.
- Strong quarterly earnings and improving momentum supported the sharp move in the stock.
Overview
DMCC Speciality Chemicals Limited (NSE: DMCC) rose 16.35% to ₹260.50 on April 13, 2026, after opening at ₹225.01 and touching an intraday high of ₹268.00. The stock emerged among the top gainers of the session as buying momentum accelerated following a breakout above its recent trading range.
The stock had been consolidating for several weeks after a prolonged decline from its 2025 highs. The latest move indicates that sentiment has improved meaningfully, especially after the stock crossed above its 50-day Simple Moving Average.
Fundamental View
DMCC Speciality Chemicals reported a better financial performance in the December 2025 quarter. The company posted total income of ₹15,102.31 lakh, compared with a profit before tax of ₹882.51 lakh.
Net profit came in at ₹616.04 lakh, while earnings per share stood at ₹2.47. The return to profitability has provided support to the recent improvement in the stock price and suggests that the company’s operating performance has stabilised.
Technical View
DMCC Speciality Chemicals is currently trading near ₹260.50, comfortably above its 50-day Simple Moving Average near ₹224.85. This marks the first decisive move above the average in several months and indicates that the broader price structure has improved.
The stock has also broken out of its recent consolidation range with a sharp rise in volume. Such a move often reflects renewed interest after a prolonged period of sideways trading.
The 14-day RSI has risen to 66.94, showing that momentum has strengthened significantly but is still below the extreme overheated zone. The RSI moving above its signal line further supports the positive near-term trend.
Key Technical Levels
The immediate downside zone is seen around ₹240.00–225.00, which may act as an important area to watch if the stock witnesses profit booking after the recent rally. On the upside, if the current momentum sustains and the stock continues to hold above its 50-day SMA, the next potential move could extend toward ₹280.00–305.00 in the near term.
Source: TradingView
Risk to Watch
- The stock has rallied sharply in a single session and may remain volatile.
- Any weakness in broader market sentiment could slow the current momentum.
- Failure to sustain above the recent breakout zone may lead to profit booking.
- Commodity and raw material price fluctuations could affect future margins.
Summary
DMCC Speciality Chemicals has shown a strong technical and fundamental improvement. The stock has moved above its 50-day SMA with strong volume support, while the company has returned to profitability in the latest quarter. Momentum remains favourable, although volatility could stay elevated after the sharp rally.
FAQs
Why did DMCC Speciality Chemicals share price rise today?
The stock rose after breaking above its recent trading range and 50-day SMA, supported by stronger quarterly earnings and improved momentum.
What is the 50-day SMA for DMCC Speciality Chemicals?
The 50-day Simple Moving Average for the stock is currently near ₹224.85.
How much profit did DMCC Speciality Chemicals report in December 2025?
The company reported a net profit of ₹616.04 lakh in the December 2025 quarter.