
- Investment Snapshot
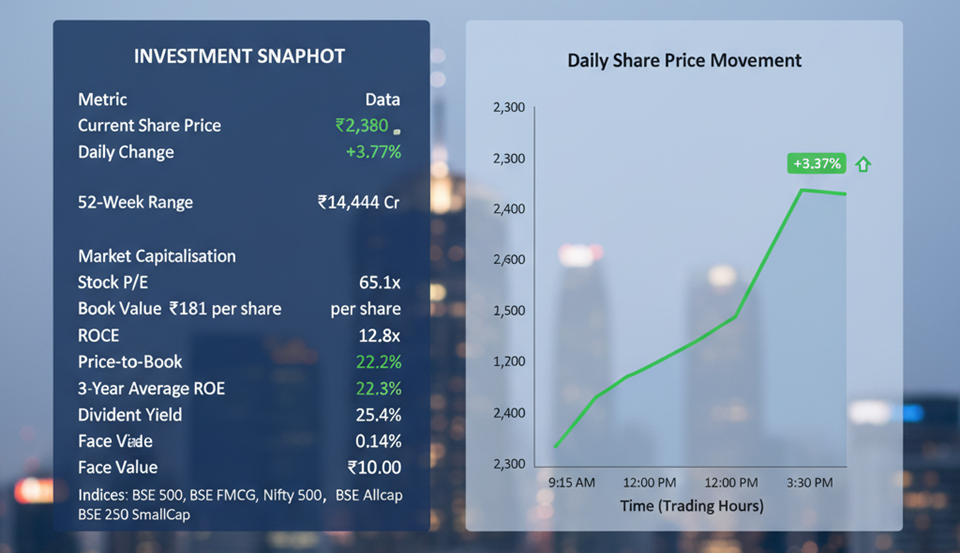
Data Source: REFINITIV, Analysis: Kalkine Group
- Company Overview
DOMS Industries Ltd (NSE: DOMS) is India's second-largest branded stationery and art products company, operating under the flagship DOMS brand — a household name across Indian schools, colleges, and art communities. Incorporated in 2006, the company has built a formidable consumer franchise over nearly two decades, achieving 29–30% market share in its core pencil and mathematical instrument box categories as of FY2023.
What distinguishes DOMS from a conventional stationery manufacturer is the scale and sophistication of its distribution and product architecture. As of December 2025, the company operates across 8 product categories with over 4,600 SKUs, reaches all 28 states and 8 union territories across India, and exports to more than 55 countries. This combination of category depth, distribution reach, and international presence positions DOMS as the closest thing to an FMCG-scale consumer brand in the Indian stationery segment — a segment that is structurally underpenetrated, growing, and driven by India's expanding school-age population and rising per-capita spending on education.
The company's Italian partner, FILA Group — one of the world's largest art and stationery companies — provides DOMS with access to global product design capabilities, technology, and international distribution networks, meaningfully differentiating it from domestic-only peers.
- Financial Performance Analysis
3.1
Data Source: REFINITIV, Analysis: Kalkine Group
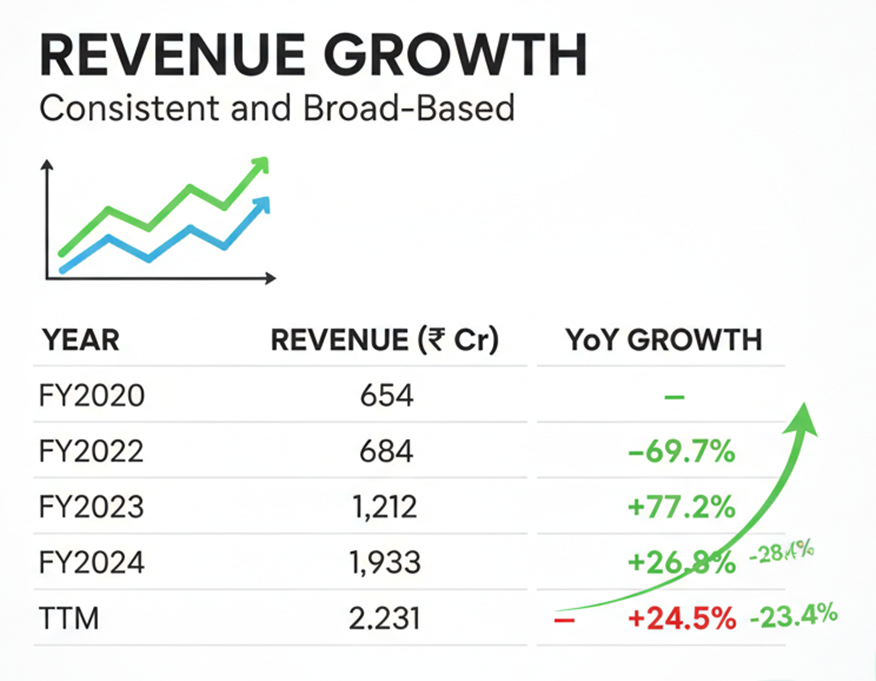
The COVID-disrupted FY2021 contraction was sharp but temporary — a reflection of school closures and distribution disruptions rather than any structural demand erosion. The recovery from FY2022 onward has been exceptional: a 3-year revenue CAGR of 41% and a 5-year CAGR of 24% reflect both post-COVID normalisation and genuine market share consolidation.
Critically, TTM revenue of ₹2,231 Cr has crossed a significant psychological and operational milestone, and the growth rate — while moderating from the post-COVID surge — has stabilised at approximately 23% year-on-year. This represents healthy, sustainable growth for a branded consumer goods business, not a boom-bust cycle.
3.2 Profitability — The Margin Inflection and Sustained Delivery
The most analytically important story in DOMS' financials is the permanent structural shift in operating profitability that occurred from FY2023 onward.
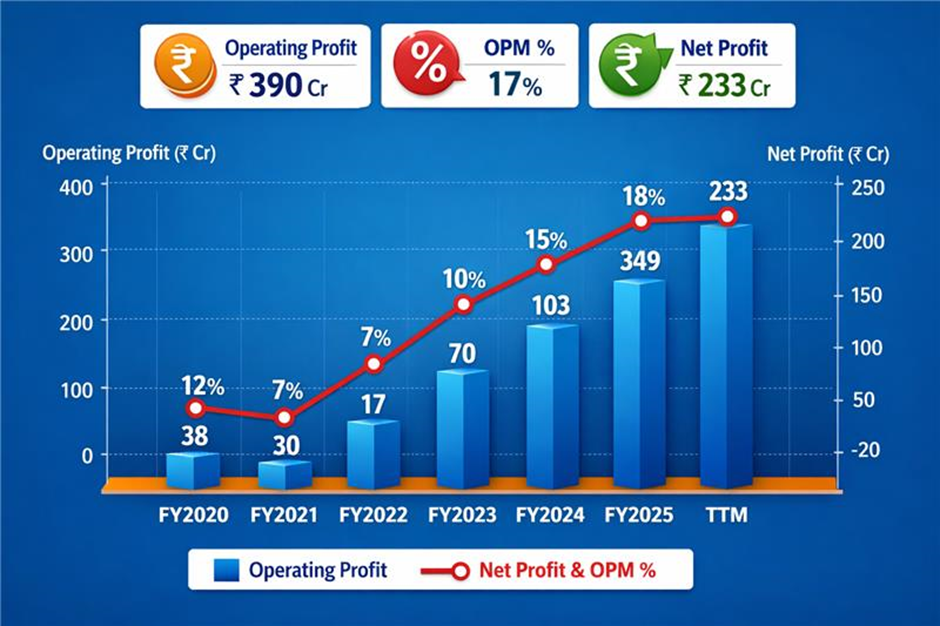
Data Source: REFINITIV, Analysis: Kalkine Group
The shift from a 10% OPM business in FY2022 to an 18% OPM business from FY2024 onward reflects operating leverage as revenue scaled, improved product mix toward higher-margin art and premium stationery categories, and the operational efficiencies of a maturing manufacturing base. The stability of the 17–19% OPM band across 10 consecutive quarters (Dec 2022 through Dec 2025) is a hallmark of a business with genuine pricing power and cost discipline — rare qualities in a mid-cap Indian consumer goods company.
Net profit has compounded at 41.2% over 5 years and 142% over 3 years — the latter figure inflated by the FY2022 low base but nonetheless reflecting a dramatic improvement in earnings quality. The TTM net profit of ₹233 Cr represents a business generating meaningful, recurring cash-backed earnings.
3.3 Quarterly Earnings — Stable and Growing
Data Source: REFINITIV, Analysis: Kalkine Group
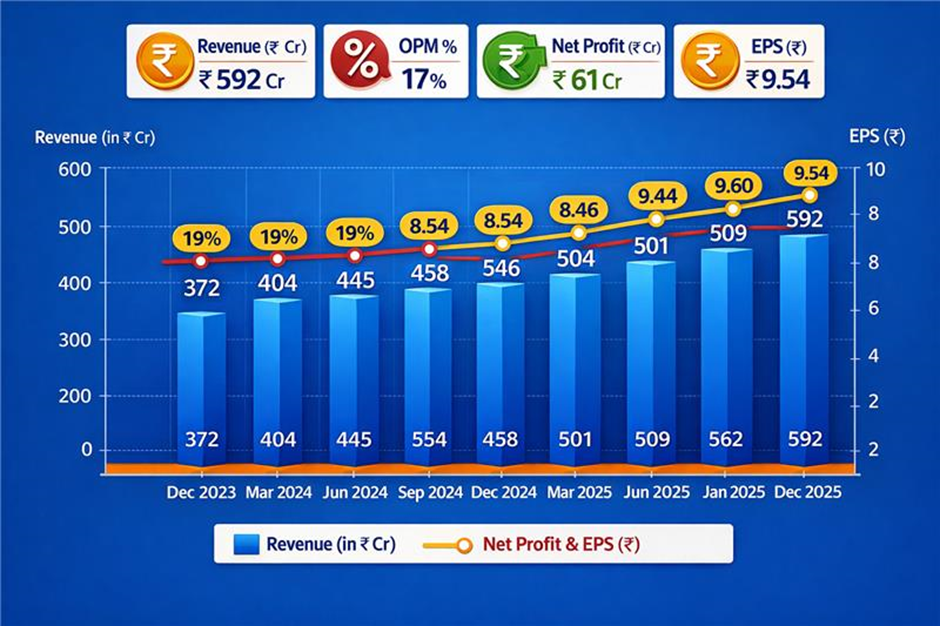
DOMS' quarterly performance is a model of earnings consistency. Revenue has grown in a straight line from ₹372 Cr in Dec 2023 to ₹592 Cr in Dec 2025 — a 59% increase over eight quarters — while OPM has held within a narrow 17–19% band throughout. Net profit per quarter has grown steadily from ₹39 Cr to ₹61 Cr, and EPS from ₹6.15 to ₹9.54.
This consistency is not a trivial achievement. Consumer goods companies with seasonal demand, input cost volatility, and distribution complexity rarely deliver eight consecutive quarters of stable margins and growing volumes. DOMS' track record here is a genuine indicator of business quality.
3.4 Return Metrics — Sector-Leading
|
Metric |
FY2023 |
FY2024 |
FY2025 |
|
ROCE |
34% |
31% |
26.2% |
|
ROE |
— |
— |
22.3% |
|
3-Year Average ROE |
25.4% |
DOMS' ROCE of 26.2% and ROE of 22.3% are among the strongest in the peer group and place it firmly in the category of high-quality consumer franchises that generate returns well above the cost of capital. The slight moderation in ROCE from 34% in FY2023 to 26% in FY2025 reflects the capital investment cycle — expanding fixed assets from ₹320 Cr to ₹690 Cr — rather than any deterioration in the underlying business economics.
A 3-year average ROE of 25.4% is a figure that commands premium valuation in the Indian consumer market context and justifies DOMS' position among the better-quality mid-cap consumer businesses on Indian exchanges.
- Balance Sheet & Capital Allocation
4.1 Capital Structure
|
Metric |
FY2023 |
FY2024 |
FY2025 |
Sep 2025 |
|
Equity Capital (₹ Cr) |
0.37 |
61 |
61 |
61 |
|
Reserves (₹ Cr) |
337 |
754 |
942 |
1,038 |
|
Borrowings (₹ Cr) |
140 |
172 |
212 |
161 |
|
Total Assets (₹ Cr) |
640 |
1,190 |
1,511 |
1,605 |
The balance sheet is conservatively structured for a growing consumer goods company. Borrowings of ₹212 Cr in FY2025 (declining to ₹161 Cr by September 2025) are modest relative to reserves of ₹1,038 Cr, implying a debt-to-equity ratio well below 0.2x. The company has the balance sheet capacity to fund continued expansion without significant dilution risk.
The step-change in equity capital in FY2024 — from ₹0.37 Cr to ₹61 Cr — reflects the IPO and associated restructuring rather than a change in economic ownership, and should be read in that context when comparing historical EPS figures (which show similarly distorted pre-IPO numbers).
4.2 Fixed Asset Expansion & Capex Cycle
|
Metric |
FY2023 |
FY2024 |
FY2025 |
Sep 2025 |
|
Fixed Assets (₹ Cr) |
320 |
498 |
690 |
752 |
|
CWIP (₹ Cr) |
7 |
25 |
60 |
101 |
Fixed assets have more than doubled from ₹320 Cr in FY2023 to ₹752 Cr by September 2025, reflecting ongoing investment in manufacturing capacity expansion. The CWIP balance of ₹101 Cr indicates further capacity coming online. This investment is being funded primarily through internal accruals and modest borrowings rather than equity dilution — a reflection of strong operating cash generation.
4.3 Working Capital — Exceptionally Well-Managed
|
Metric |
FY2023 |
FY2024 |
FY2025 |
|
Debtor Days |
11 |
15 |
26 |
|
Inventory Days |
88 |
92 |
99 |
|
Days Payable |
42 |
37 |
37 |
|
Cash Conversion Cycle |
57 |
70 |
88 |
|
Working Capital Days |
2 |
25 |
39 |
DOMS' working capital profile is exceptional by consumer goods standards. Debtor days of just 26 — compared to peers like Kaynes (77 days) and Jyoti CNC (98 days) — reflect the company's strong commercial positioning with distributors, most of whom operate on short credit terms or cash terms. The slight increase in debtor days and inventory days in FY2025 (from the exceptional FY2023 lows) is consistent with a distribution network expansion that temporarily absorbs more working capital. The cash conversion cycle of 88 days remains healthy.
4.4 Cash Flow Profile — The Critical Differentiator
|
Year |
CFO (₹ Cr) |
FCF (₹ Cr) |
CFO/OP |
|
FY2022 |
51 |
16 |
78% |
|
FY2023 |
173 |
38 |
111% |
|
FY2024 |
183 |
29 |
91% |
|
FY2025 |
183 |
-26 |
74% |
DOMS' cash flow profile stands in sharp contrast to Kaynes and Jyoti CNC — both of which have generated deeply negative free cash flow in recent years. DOMS has generated positive operating cash flow in every year, with CFO of ₹183 Cr in both FY2024 and FY2025. The CFO/Operating Profit ratio of 74–111% indicates that a high proportion of reported profits are being converted into actual cash — the hallmark of a business with genuine pricing power and low working capital intensity.
FY2025's mildly negative FCF of -₹26 Cr reflects the capex investment cycle rather than operational cash consumption and is expected to normalise as the capacity expansion cycle moderates.
- Peer Comparison
|
Company |
CMP (₹) |
P/E |
Mkt Cap (₹ Cr) |
NP Qtr (₹ Cr) |
Qtr Rev (₹ Cr) |
Rev Growth % |
ROCE % |
|
DOMS Industries |
2,380 |
65.1x |
14,444 |
61 |
592 |
+18.2% |
26.2% |
|
Flair Writing |
291 |
22.8x |
3,069 |
33 |
318 |
+20.1% |
16.1% |
|
Kokuyo Camlin |
74 |
28.3x |
745 |
4 |
178 |
+10.8% |
3.7% |
|
Linc |
94 |
14.9x |
560 |
7 |
125 |
+6.3% |
22.4% |
|
Alkosign |
56 |
71.1x |
60 |
0.4 |
26 |
-5.6% |
12.8% |
|
Sector Median (4 cos) |
— |
25.5x |
1,907 |
20.3 |
248 |
+14.5% |
19.3% |
Key Peer Observations
DOMS commands a substantial valuation premium: At 65.1x P/E and a ₹14,444 Cr market cap, DOMS trades at nearly 3x the sector median P/E and dwarfs the next-largest listed peer Flair Writing (₹3,069 Cr). The premium is justified by its superior scale, ROCE, brand strength, and earnings consistency — but it also means the margin of safety at current prices is limited.
ROCE leadership is decisive: DOMS' ROCE of 26.2% is materially ahead of all listed peers. Flair Writing (16.1%), Kokuyo Camlin (3.7%), and Alkosign (12.8%) all lag significantly. Only Linc (22.4%) approaches DOMS' capital efficiency, and Linc trades at just 14.9x P/E — illustrating the premium the market ascribes specifically to DOMS' brand, scale, and growth profile.
Revenue scale and growth are unmatched: At ₹592 Cr quarterly revenue with 18.2% growth, DOMS generates nearly double the revenue of Flair Writing (₹318 Cr) and more than three times Kokuyo Camlin (₹178 Cr). No listed stationery peer is close to DOMS in revenue scale, which creates structural competitive advantages in procurement, distribution investment, and marketing reach.
Profitability quality is in a different category: DOMS' quarterly net profit of ₹61 Cr compares to Flair's ₹33 Cr, Linc's ₹7 Cr, and Kokuyo Camlin's ₹4 Cr. In profitability terms, DOMS is effectively the entire sector.
- Recent Corporate Developments
Pioneer Stationary Acquisition
On March 31, 2026, DOMS purchased an additional 3,900 shares of Pioneer Stationary Products for ₹5.54 Cr, increasing its stake to 64.0%. This incremental acquisition reflects DOMS' strategy of building out its product and distribution ecosystem through targeted bolt-on acquisitions — consistent with the approach of quality consumer companies that supplement organic growth with complementary asset additions.
DOMS Foundation Incorporation
The incorporation of DOMS Foundation (March 2026) as an 80%-owned Section 8 company as a CSR implementing agency reflects the formalisation of the company's social responsibility framework as it grows to a scale where structured CSR deployment becomes both mandatory and strategically relevant.
GST Order — Subsidiary (Uniclan)
A GST order against subsidiary Uniclan for inadmissible ITC of ₹5.23 Lakh with a penalty of ₹10.45 Lakh (received March 2026) is a routine regulatory matter, immaterial in scale, and does not represent a governance or financial risk of significance.
- Shareholding Pattern Analysis
|
Category |
Dec 2023 |
Dec 2024 |
Dec 2025 |
1-Year Change |
|
Promoters |
74.95% |
70.38% |
70.38% |
0.00% |
|
FIIs |
6.13% |
9.96% |
8.38% |
-1.58% |
|
DIIs |
15.14% |
15.71% |
18.28% |
+2.57% |
|
Public |
3.77% |
3.95% |
2.96% |
-0.99% |
|
No. of Shareholders |
51,954 |
61,888 |
57,647 |
— |
The shareholding pattern for DOMS is one of the cleanest in this report series. Several observations stand out:
Promoter stability: Promoter holding was 74.95% through to September 2024, declined to 70.38% in December 2024, and has remained absolutely stable at 70.38% through December 2025. The one-time reduction likely reflects a secondary market sale or regulatory alignment, but the subsequent stability signals that promoter selling is not a continuing concern — a sharp contrast to Kaynes Technology where promoter holding has fallen 10 percentage points over two years.
DII accumulation: Domestic institutional investors have steadily increased holdings from 15.14% in December 2023 to 18.28% in December 2025. This consistent accumulation by domestic mutual funds and insurance companies reflects growing institutional conviction in the DOMS quality story.
Low public float: At just 2.96% public holding, DOMS has an exceptionally tight free float. Combined with 70.38% promoter holding and 18.28% DII ownership, approximately 97% of the stock is held by entities with long-duration investment horizons. This structural illiquidity tends to support price stability but can also amplify moves — in either direction — when sentiment shifts.
- Key Strengths
Brand and market position: DOMS is the #2 branded stationery company in India with 29–30% market share in core categories. The DOMS brand is deeply embedded in the school-age consumer decision cycle — a purchasing pattern that begins in early childhood and creates decades-long brand loyalty.
Operating margin consistency: Seventeen to nineteen percent OPM sustained across 10 consecutive quarters, with no quarter below 16% in the entire available dataset, is exceptional. This consistency reflects genuine pricing power and cost discipline.
FILA partnership advantage: Access to FILA's global product portfolio, manufacturing technology, and distribution relationships provides DOMS with a product development and international expansion capability that no domestic-only stationery peer can replicate.
Cash flow generation: Positive operating cash flow in every year of available data (including the COVID year), with CFO/OP ratios consistently above 70%. This is the cash quality profile of a mature, well-run consumer franchise.
Return on capital: A 26.2% ROCE and 25.4% three-year average ROE are top-quartile for any Indian mid-cap consumer business, not just the stationery segment.
Expansion runway: Export presence in 55+ countries, 8 product categories, and 4,600+ SKUs provide multiple independent growth vectors across geographies and product lines.
- Key Risks
|
Risk Factor |
Description |
Severity |
|
Valuation Premium |
65.1x P/E and 12.8x book value leave limited margin of safety |
High |
|
1-Year Price Correction |
-16% from 52-week highs; market has de-rated from peak |
Moderate |
|
Working Capital Creep |
Debtor and working capital days increasing from historically low levels |
Moderate |
|
Low Float Liquidity |
2.96% public float; large trades can move price significantly |
Moderate |
|
Competition Risk |
Flair Writing, Kokuyo Camlin, and private label pressure |
Low–Moderate |
|
Raw Material Exposure |
Wood, graphite, and polymer input costs subject to global price cycles |
Low–Moderate |
|
Geographic Concentration |
India remains the dominant revenue source; export contribution growing but modest |
Low |
- Bull & Bear Case
Bull Case
DOMS consolidates its position as the dominant branded stationery company in India as the school-age population continues to expand and per-capita stationery spending rises with income levels. The Pioneer and other acquisitions expand category adjacencies. International exports scale meaningfully across FILA's distribution network. Operating margins are maintained in the 17–19% band as premiumisation in art materials offsets any pencil margin compression. The stock recovers toward and beyond its 52-week high of ₹3,065 as earnings compound at 20–25% annually and institutional ownership continues to build.
Bear Case
The valuation premium — 65x P/E and 12.8x book — proves unsustainable in a broader mid-cap de-rating environment. Growth moderates below 20% as the post-COVID distribution expansion normalises. Working capital days continue to creep upward, reducing cash conversion quality. The low public float amplifies selling pressure in a risk-off market, accelerating price declines. The stock revisits the lower end of its 52-week range (₹2,007) or below as the P/E multiple compresses toward sector median levels.
- Valuation Assessment
At ₹2,380 and a TTM EPS of approximately ₹36.56, DOMS trades at approximately 65x TTM earnings. On a forward basis — assuming continued quarterly earnings of approximately ₹60 Cr, implying FY2026 net profit of approximately ₹240–250 Cr — the forward EPS is approximately ₹38–40, giving a forward P/E of 59–63x.
The 12.8x Price-to-Book is the highest of any company covered in this report series — but must be contextualised against a 25.4% three-year average ROE. A simple Gordon-Growith model framework suggests that a business with 25% ROE, 15% sustainable growth, and a 12% cost of equity justifies a Price-to-Book above 10x. On this framework, the current valuation is rich but not irrational.
The 16% share price decline from the FY2025 peak of ₹3,065 has brought the multiple from extreme to elevated. For investors with a 3–5 year view and conviction in DOMS' brand positioning and earnings compounding, the current level represents a more attractive entry than the 52-week high — though not a deep value opportunity.
- Investment Conclusion
DOMS Industries is the highest-quality business in the Indian listed stationery sector by a considerable margin. Its combination of brand strength, consistent operating margins, high capital returns, clean balance sheet, and positive cash flow generation produces a financial profile more commonly associated with established FMCG companies than a mid-cap stationery manufacturer.
The investment case is not complicated. India's school-age population is growing; per-capita spending on branded stationery and art materials is rising; and DOMS is the dominant domestic player in a segment with limited international competition. The FILA partnership provides global reach and product capability that cannot be easily replicated.
The primary investment risk is not operational — it is valuation. At 65x earnings and 12.8x book, the stock prices in a significant amount of future growth. Investors must be comfortable holding through periods where the multiple compresses even as earnings grow, which is the normal experience of investing in high-quality compounders at premium prices.
For long-term investors focused on quality rather than cheapness, DOMS represents the closest equivalent to an FMCG-quality compounder in the Indian education and stationery space — a category with structural demand growth, limited disruption risk, and a brand that is embedded in the daily lives of hundreds of millions of Indian students.
Investor suitability: Quality-growth investors with a 3–5 year horizon who prioritise high ROCE, consistent earnings, and brand durability over near-term valuation comfort. Not suited to value investors seeking low multiples or short-term traders seeking rapid catalysts.