
Highlights
- Dynamatic Technologies shares fell over 6% after the latest quarterly earnings update.
- The stock slipped below its 50-day SMA amid elevated selling pressure.
- Q4 consolidated net profit stood at INR 1,256 million for March 2026 quarter.
Overview
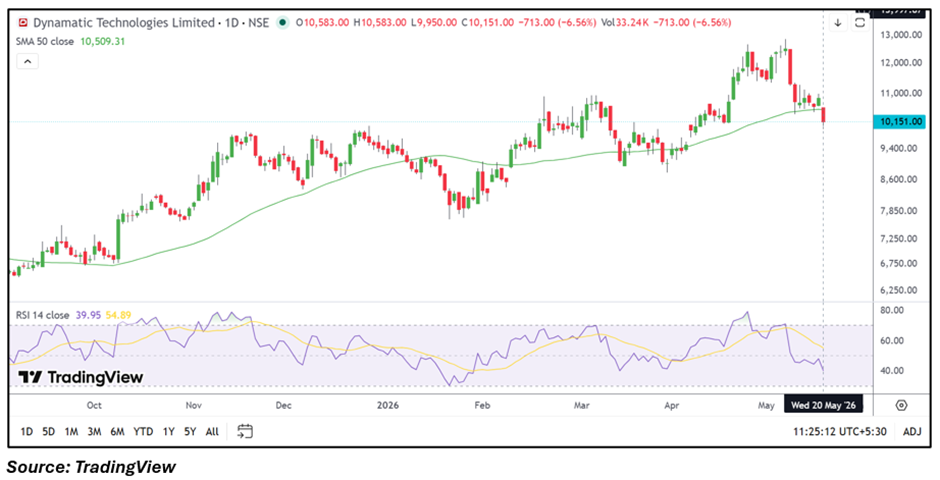
Dynamatic Technologies Limited (NSE: DYNAMATECH) shares declined 6.56% to INR 10,151.00 on May 20, 2026, placing the stock among the notable losers on the NSE after the company announced its March quarter financial results.
The stock opened at INR 10,583.00 and touched an intraday low of INR 9,950.00 during the session. Trading activity remained elevated as the stock witnessed sharp selling pressure following the earnings announcement.
For the quarter ended March 2026, the company reported consolidated total income of INR 44,008 million. Profit before tax stood at INR 1,528 million, while net profit came at INR 1,256 million. Earnings per share for the quarter was reported at INR 18.50.
Fundamental View
Dynamatic Technologies operates in the aerospace, defence, hydraulics, and precision engineering segment, with business exposure linked to industrial manufacturing and aviation-related demand.
The latest quarterly update triggered heightened market activity in the stock. Investors are likely to monitor order inflows, export demand, execution timelines, and margin movement in the coming quarters.
Technical View
Dynamatic Technologies is currently trading below its 50-day SMA near INR 10,509.31, reflecting weakening near-term structure after the recent decline. The stock also witnessed sharp selling pressure after failing to sustain near recent highs, indicating softer short-term momentum conditions.
The 14-day RSI slipped near 39.95 and moved below its signal line, reflecting weakening momentum after the recent correction. The momentum oscillator has also turned lower, indicating fading short-term price strength and increasing volatility during the ongoing pullback phase.
Key Technical Levels
Dynamatic Technologies has immediate support placed near INR 9,800, while the stronger support zone is seen around INR 9,000. On the upside, the stock may face immediate resistance near INR 10,600, followed by the INR 11,200 zone, which could remain important if the stock attempts a recovery.
Key Risks
- Weak industrial demand may impact order visibility.
- Export slowdown could affect revenue growth trends.
- Elevated volatility may continue after recent correction.
- Margin pressure could affect profitability in coming quarters.
Summary
Dynamatic Technologies (NSE: DYNAMATECH) witnessed sharp selling pressure after its March quarter earnings announcement, with the stock declining more than 6% during Wednesday’s session. The stock has slipped below its 50-day SMA while RSI and momentum oscillators also weakened notably. Traders may now monitor whether the stock holds above the INR 9,800 support zone, while resistance around INR 10,600–11,200 could remain important in the near term.
FAQs
- Why did Dynamatic Technologies shares fall today?
The stock declined after the company announced its March 2026 quarterly earnings amid elevated selling pressure. - What is the support zone for DYNAMATECH stock?
Immediate support is placed near INR 9,800, while stronger support is seen around INR 9,000. - What resistance levels should traders watch in Dynamatic Technologies?
The stock may face near-term resistance around INR 10,600 and the INR 11,200 zone.