
Highlights
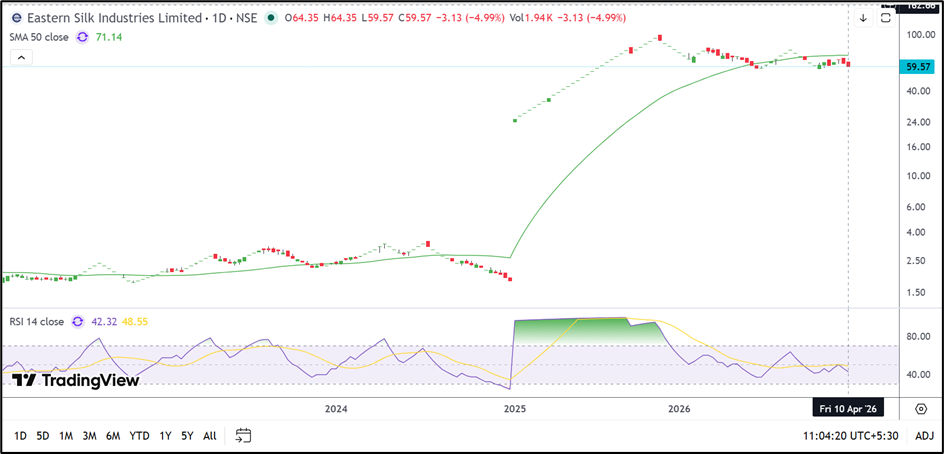
- Eastern Silk Industries Limited (NSE: EASTSILK) declined 4.99% to ₹59.57.
- The stock remains below its 50-day SMA of ₹71.14 after failing near ₹65.00.
- RSI eased to 42.32, indicating weakening momentum in the near term.
Overview
Eastern Silk Industries Limited (NSE: EASTSILK) came under pressure on April 10, 2026, after the stock fell 4.99% to ₹59.57. The decline followed a recent attempt to stabilise near the ₹65.00 level, but the stock failed to hold those gains and slipped back toward the lower end of its recent range.
The stock opened at ₹64.35 and remained weak throughout the session. It touched an intraday low of ₹59.57, which was also the closing level, reflecting continued selling pressure.
Fundamental View
For the quarter ended December 2025, Eastern Silk Industries Limited reported standalone total income of ₹722.74 lakh. The company recorded a loss before tax of ₹37.19 lakh, while net profit stood at ₹34.00 lakh. Earnings per share for the quarter was ₹0.68.
Although the company reported a marginal profit, the stock has continued to struggle because the broader price structure remains weak.
Technical View
Eastern Silk Industries Limited is currently trading near ₹59.57 and remains below its 50-day Simple Moving Average near ₹71.14. The stock has traded below this average for most of 2026, indicating that the broader trend continues to remain under pressure.
The chart shows that Eastern Silk Industries witnessed a sharp rise toward the ₹90.00–₹100.00 region during late 2025, but the stock has steadily weakened since then. The latest decline suggests that the stock may be entering another phase of downside pressure after failing to sustain above ₹65.00.
The latest candle also reflects renewed weakness after several sessions of sideways movement. This suggests that sellers continue to remain active near higher levels.
The 14-day RSI is currently near 42.32, which is below the neutral 50 mark and reflects softer momentum. Unless the stock recovers above the recent trading zone, the near-term structure may continue to remain weak.
Key Technical Levels
On the downside, the immediate support zone is placed between ₹55.00 and ₹50.00. A move below ₹55.00 may increase downside pressure further.
On the upside, Eastern Silk Industries is likely to face resistance between ₹65.00 and ₹69.00. The stock may need to move above this zone to improve the near-term structure.
Source: TradingView
Risks To Watch
- The stock continues to trade below its 50-day SMA.
- Failure to hold above ₹55.00 may increase downside pressure.
- RSI remains below the neutral zone and reflects weak momentum.
- Continued selling near ₹65.00 may limit any short-term recovery.
Summary
Eastern Silk Industries Limited (NSE: EASTSILK) remains under pressure after slipping nearly 5.00% and staying below its 50-day SMA. The chart structure continues to remain weak, while momentum indicators also suggest that the stock is facing renewed downside pressure. Traders may now watch whether the stock can hold above ₹55.00 or weaken further in the coming sessions.