
Highlights
- Embassy Developments Ltd (NSE: EMBASSY) fell 5.00% to ₹47.70 after opening at ₹47.70 and touching an intraday high of ₹48.50.
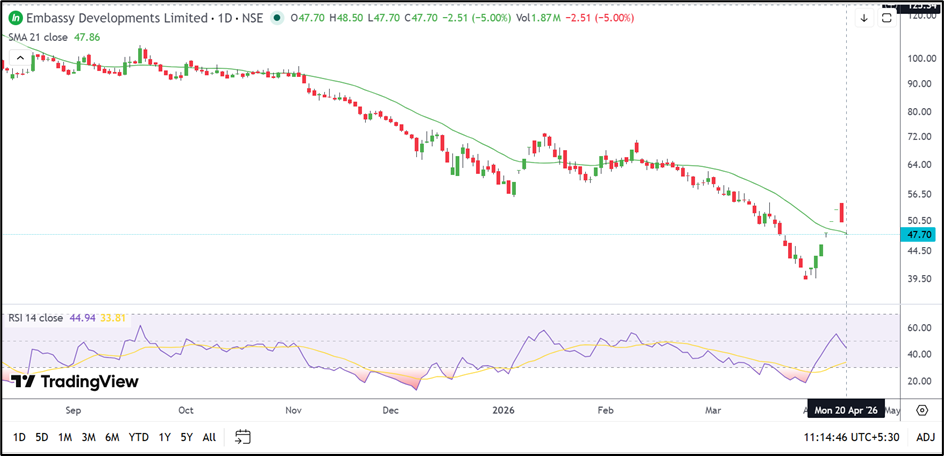
- The stock remains below its 21-day SMA of ₹47.86 despite a brief rebound from recent lows near ₹40.00.
- Embassy reported a consolidated net loss of ₹23,371.70 lakh for the December 2025 quarter.
Overview
Embassy Developments Ltd (NSE: EMBASSY) declined 5.00% to ₹47.70, extending the recent weakness after failing to hold above the ₹50.00 area. The stock had staged a short-lived rebound from the April low near ₹40.00, but fresh selling pressure quickly erased those gains.
The broader structure remains weak, with the stock still trading far below the higher levels seen earlier in the year. The latest decline suggests that the recent bounce may have been temporary rather than the beginning of a sustained recovery.
Fundamental View
For the quarter ended December 2025, Embassy Developments reported consolidated total income of ₹26,401.90 lakh.
However, the company remained deeply loss-making. Profit before tax stood at a loss of ₹23,864.10 lakh, while net loss came in at ₹23,371.70 lakh. Earnings per share was negative at ₹-1.68.
The sharp losses indicate that the company is still facing significant pressure in its operating performance. Weak earnings have continued to weigh on investor sentiment and have limited the stock’s ability to build a lasting recovery.
Technical View
Embassy Developments is trading near ₹47.70 and remains slightly below its 21-day SMA of ₹47.86, indicating that the short-term trend has not yet turned positive.
The chart shows that the stock rebounded sharply from the recent low near ₹40.00, but the move stalled almost immediately near the ₹50.00–52.00 region. The latest candle reflects renewed selling after that failed recovery attempt.
The 14-day RSI stands at 44.94, recovering from lower levels but still below the neutral 50 mark. This suggests that momentum has improved slightly from the earlier weakness, although it remains fragile.
Key Technical Levels
The ₹42.00–37.90 zone is likely to act as the next important support area if the stock continues to weaken. A break below ₹37.90 may expose the stock to another round of downside pressure.
On the upside, Embassy Developments may face resistance near ₹51.00–54.25. The stock would need to move back above this region to indicate that a stronger recovery phase is developing.
Source: TradingView
Risks to Watch
- The company continues to report heavy losses despite stable revenue.
- The stock remains below its short-term moving average.
- A failure to hold above ₹42.00 may weaken the near-term structure further.
- The recent rebound has already faded once, raising the risk of another failed recovery.
Summary
Embassy Developments Ltd (NSE: EMBASSY) remains under pressure after another weak session and continued losses in the December 2025 quarter. While the stock has recovered from the recent low near ₹40.00, it is still struggling to sustain that bounce. Unless Embassy moves back above the ₹51.00–54.25 region, the broader tone may remain cautious.
FAQs
Why did Embassy Developments share price fall today?
Embassy Developments fell after the stock failed to sustain its recent rebound and continued to face pressure from weak quarterly performance.
Is Embassy Developments trading above its 21-day SMA?
No. The stock is currently trading slightly below its 21-day SMA of ₹47.86.
What are the next important levels for Embassy Developments?
Support is placed near ₹42.00–37.90, while resistance is seen around ₹51.00–54.25.