
Highlights
- EMS Limited shares surged nearly 15% and emerged among the top NSE gainers.
- The stock crossed a major resistance zone and reached a fresh multi-month high.
- Strong volume expansion accompanied the breakout, signaling increased market participation.
Overview
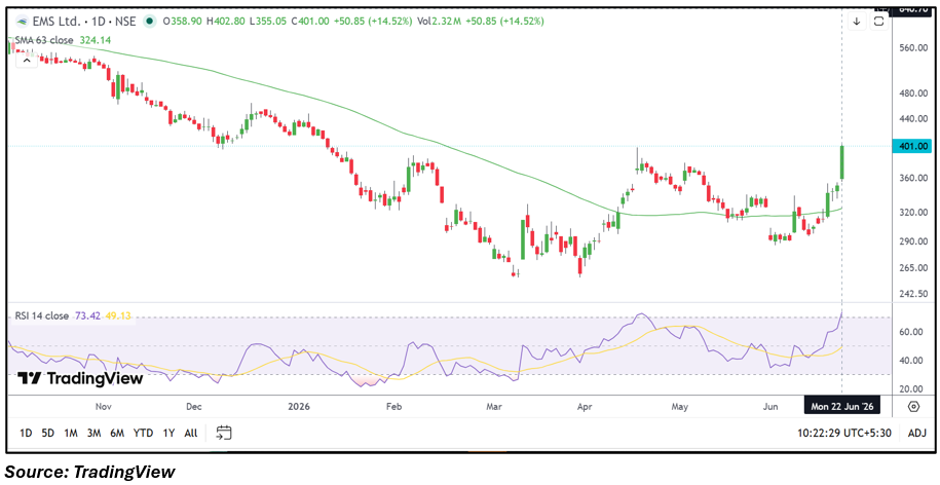
EMS Limited (NSE: EMSLIMITED) witnessed a sharp rally on June 22, with the stock advancing more than 14% to around ₹401.25. The move pushed the stock above the psychologically important ₹400 mark and placed it among the top-performing counters on the NSE. The rally was supported by robust trading volumes and a decisive breakout from its recent consolidation range.
The latest price action indicates renewed investor interest as the stock attempts to extend its recovery trend after several months of volatile trading activity.
Fundamental View
For the quarter ended March 2026, EMS Limited reported consolidated total income of ₹12,356.57 lakh. The company posted profit before tax of ₹1,476.51 lakh and net profit of ₹571.12 lakh. Earnings per share for the quarter stood at ₹1.01.
The company remains profitable, and recent financial performance has helped maintain market interest. Investors are likely to monitor future order inflows, execution performance, and earnings growth to assess whether the current momentum can be sustained over the longer term.
Technical View
The stock has delivered a strong breakout above the ₹350–370 zone, which had acted as a significant resistance area during recent weeks. The sharp move was accompanied by strong volume expansion, suggesting broad-based participation in the rally.
Price action is trading comfortably above the 63-day moving average of ₹324.14, reinforcing the improving trend structure. The RSI has climbed above 70, reflecting strong momentum conditions. The breakout above the ₹400 mark has further strengthened the near-term technical setup and placed the stock on traders’ radar.
Key Technical Levels
On the technical chart, immediate support is placed near ₹380.00, followed by the next support level around ₹350.00. On the upside, the stock may face resistance near ₹410.00, while a sustained move above this zone could open the way toward ₹440.00. These levels are likely to remain important reference points for traders assessing the stock’s post-breakout trajectory.
Risks to Watch
- Sharp rallies may attract short-term profit booking.
- Failure to sustain above ₹400 could trigger consolidation.
- Project execution delays may affect earnings visibility.
- Broader market volatility could impact momentum-driven stocks.
Summary
EMS Limited has gained significant market attention after breaking above a key resistance zone and reclaiming the ₹400 level. The combination of strong volume, improving momentum, and a favourable technical structure has strengthened the stock’s near-term outlook. While the breakout signals renewed bullish sentiment, investors will closely monitor whether the stock can maintain momentum above its breakout levels and sustain the move toward higher trading zones.
FAQ
- Why is EMS Limited stock rising today?
The stock surged after breaking above a major resistance zone with strong trading volumes and improving momentum.
- What were EMS Limited's latest quarterly results?
For the March 2026 quarter, EMS reported net profit of ₹571.12 lakh and EPS of ₹1.01.
- What are the important levels to watch in EMS stock?
Support is placed near ₹380.00 and ₹350.00, while resistance is seen around ₹410.00 and ₹440.00.