
Highlights
- EMS Limited advanced 13.71% to ₹393.05 after touching an intraday high of ₹398.95. stock is now trading well above its 21-day SMA of ₹303.22 after a steep recovery from March lows.
- Support is placed at ₹365.00–345.00, while the next resistance zone is seen near ₹440.00–480.00.
Overview
EMS LiEMS Limited (NSE: EMS) climbed 13.71% to ₹393.05 after opening at ₹369.85 and moving to an intraday high of ₹398.95.as now recovered sharply from the March low near ₹255.00 and has emerged as one of the strongest performers among mid-cap names.
The latest rally pushed EMS to its highest level in several months and confirmed a decisive reversal from the earlier downtrend. The move also came with strong price expansion, suggesting that the recent uptrend is attracting wider market attention.
Fundamental View
For the quarter ended December 2025, EMS reported consolidated total income of ₹20,288.16 lakh.
Profit before tax stood at ₹2,715.80 lakh, while net profit came in at ₹1,928.05 lakh. Earnings per share was ₹3.39.
Unlike many recent gainers, EMS is also backed by profitable quarterly performance. The strong earnings profile has added support to the sharp improvement in the share price.
Technical View
The technical structure has strengthened considerably over the last few weeks. EMS is now trading far above its 21-day Simple Moving Average of ₹303.22, indicating that the short-term trend has turned firmly positive.
The stock has broken through multiple earlier swing zones and has now reclaimed the ₹390.00 region. The recent sequence of higher highs and higher lows suggests that the rebound is developing into a sustained uptrend rather than a brief recovery.
At the same time, momentum is beginning to look stretched. The 14-day RSI has climbed to 74.97, which places the stock close to overbought territory and may increase the chances of near-term consolidation.
Still, the broader chart remains constructive as long as EMS continues to hold above the ₹365.00 zone.
Key Technical Levels
The ₹365.00–345.00 area may now act as the first support region if the stock witnesses profit-booking after the recent rally.
On the upside, the next resistance zone is placed near ₹440.00–480.00. A move above ₹480.00 may strengthen the current uptrend further.
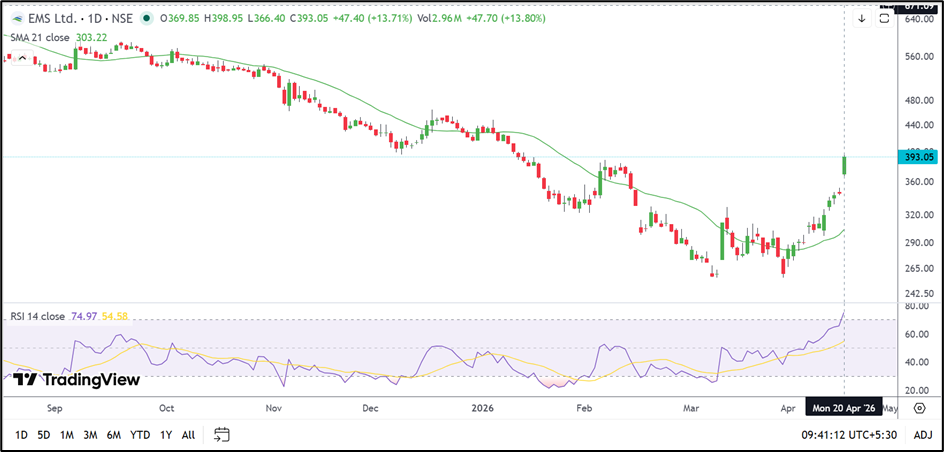
Source: TradingView
Risks to Watch
- The RSI near 75.00 suggests that the stock may be entering an overheated zone.
- Sharp rallies can often lead to short-term consolidation or profit-booking.
- A fall below ₹365.00 may weaken the present recovery structure.
- The stock has already risen significantly from its March low, which may limit fresh upside in the near term.
Summary
EMS has transformed into one of the market’s strongest recovering stocks after a sharp rebound from its March lows. Unlike several other recent gainers, the rally is supported by profitable quarterly numbers and improving chart structure. While near-term consolidation cannot be ruled out after the latest surge, the broader trend remains positive as long as the stock stays above ₹365.00.
FAQs
Why did EMS share price rise today?
EMS rose sharply after extending its strong recovery and breaking above earlier resistance zones.
Is EMS trading above its 21-day SMA?
Yes. EMS is trading above its 21-day SMA of ₹303.22.
What are the next key levels for EMS?
Support is placed at ₹365.00–345.00, while resistance is seen near ₹440.00–480.00.