
Highlights
- EMS Limited surged over 13% and emerged among the top gainers.
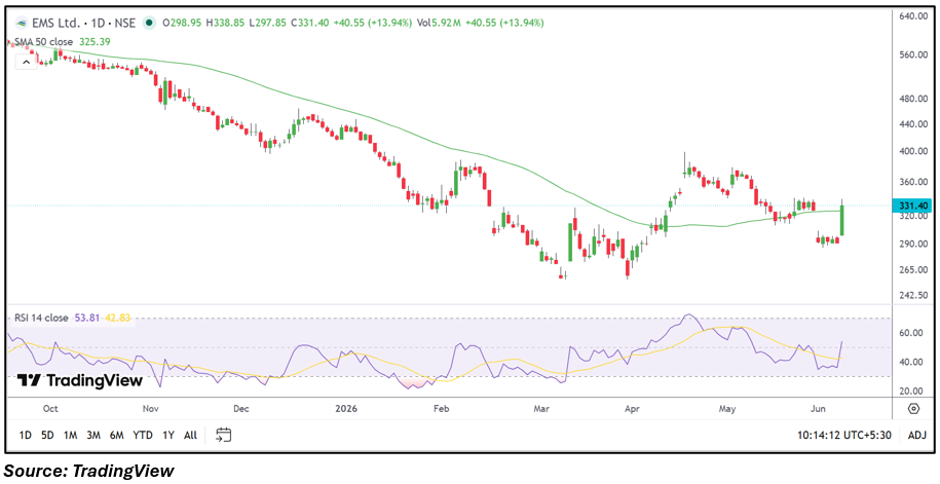
- The stock reclaimed its 50-day SMA after a sharp upside breakout.
- RSI improved above the neutral zone, indicating strengthening momentum.
Overview
EMS Limited (NSE: EMSLIMITED) gained 13.58% to ₹330.35 on June 8, 2026, placing it among the top-performing stocks on the NSE. The rally followed a sharp rebound from recent lows, with the stock moving decisively above its 50-day Simple Moving Average (SMA) of ₹325.39. Increased trading activity and a strong intraday move toward ₹338.85 reflected renewed market interest in the counter.
Fundamental View
EMS Limited operates in the water and wastewater infrastructure segment. For the quarter ended December 2024, the company reported total income of INR 24,498.43 lakh, profit before tax of INR 6,924.22 lakh, and net profit of INR 5,018.56 lakh. Earnings per share stood at INR 9.04. Investors may continue tracking execution of infrastructure projects, order inflows, and profitability trends.
Technical View
EMS Limited is trading at ₹330.35, slightly above its 50-day SMA of ₹325.39, indicating an improvement in the near-term technical structure. Price action shows the stock has rebounded sharply from a recent consolidation zone and reclaimed an important moving average. The 14-day RSI has risen to 53.81, moving above the neutral mark and suggesting improving momentum. Sustaining above the breakout region could support further recovery attempts, while failure to hold current levels may result in renewed consolidation.
Momentum Indicator
The RSI reading of 53.81 reflects strengthening momentum after spending several sessions below the midpoint. The indicator remains below overbought territory, leaving room for further price movement if buying momentum continues.
Key Technical Levels
At the current market price of ₹330.35, the immediate support zone is placed near ₹313.83, followed by a stronger support area around ₹297.32. On the upside, the stock faces resistance near ₹346.87, while the next resistance zone is positioned around ₹363.39. A sustained move above resistance levels could improve the short-term trend structure.
Risks to Watch
- Infrastructure project execution delays.
- Margin pressure from rising input costs.
- Dependence on government-related contracts.
- Broader market volatility affecting mid-cap stocks.
Summary
EMS Limited has staged a notable rebound and moved back above its 50-day SMA, improving the near-term technical outlook. The rise in RSI and strong price action indicates strengthening momentum, although confirmation of a broader trend reversal will depend on the stock's ability to sustain above key support zones and continue building on the recent breakout.
FAQs
Why did EMS Limited shares rise today?
The stock rallied after a sharp rebound from recent lows and reclaimed its 50-day SMA.
What does the RSI indicate for EMS Limited?
The RSI of 53.81 indicates improving momentum and a shift back above the neutral zone.
What are the key levels to watch?
Support levels are ₹313.83 and ₹297.32, while resistance levels are ₹346.87 and ₹363.39.