
Highlights
- Eternal Limited (NSE: ETERNAL) declined 4.70% in Thursday’s session.
- December quarter consolidated net profit stood at INR 10,200.00 lakh.
- The stock remains below its 50-day moving average near INR 256.72.
Eternal Limited (NSE: ETERNAL) traded lower on 2 April 2026, with the stock moving near INR 225.40, down 4.70% from its previous close of INR 236.52. The stock opened at INR 230.95 and touched an intraday high of INR 232.39, while the day’s low stood at INR 225.40. VWAP for the session was recorded at INR 227.66.
The latest decline came as Eternal Limited (NSE: ETERNAL) extended its recent weakness after failing to sustain above the INR 240.00 zone. The stock also continues to trade below its 50-day Simple Moving Average near INR 256.72, indicating that the broader structure remains weak.
Fundamental View: December Quarter Earnings Stay Positive
For the quarter ended 31 December 2025, Eternal Limited (NSE: ETERNAL) reported consolidated total income of INR 16,66,300.00 lakh. Profit before tax stood at INR 17,000.00 lakh, while net profit came in at INR 10,200.00 lakh. Earnings per share for the quarter was reported at INR 0.11.
The latest quarterly numbers indicate that the company remained profitable during the quarter. Even so, the stock continues to trade with a price-to-earnings ratio above 50.00 over the previous four trailing quarters.
Technical View: Stock Slips Back Toward Recent Low Zone
Eternal Limited (NSE: ETERNAL) is currently trading near INR 225.40 and remains below its 50-day Simple Moving Average near INR 256.72. The chart continues to reflect a weak trend, with lower highs and lower lows dominating price action.
The recent rebound from the INR 210.00 area has started to fade, while the stock has again slipped below the INR 230.00 mark. The 14-day RSI stands near 41.21, showing that momentum has improved slightly from weaker levels but remains below the neutral 50 mark.
Unless Eternal Limited (NSE: ETERNAL) moves back above the INR 250.00 zone, the current structure may continue to reflect a broader correction phase rather than a sustained recovery.
Key Technical Levels
At INR 225.40, immediate support is seen near INR 205.00, followed by stronger downside support around INR 190.00. On the upside, resistance is placed near INR 250.00–275.00.
A move above INR 250.00 could improve the short-term outlook, while failure to hold above INR 205.00 may bring the recent low zone back into focus.
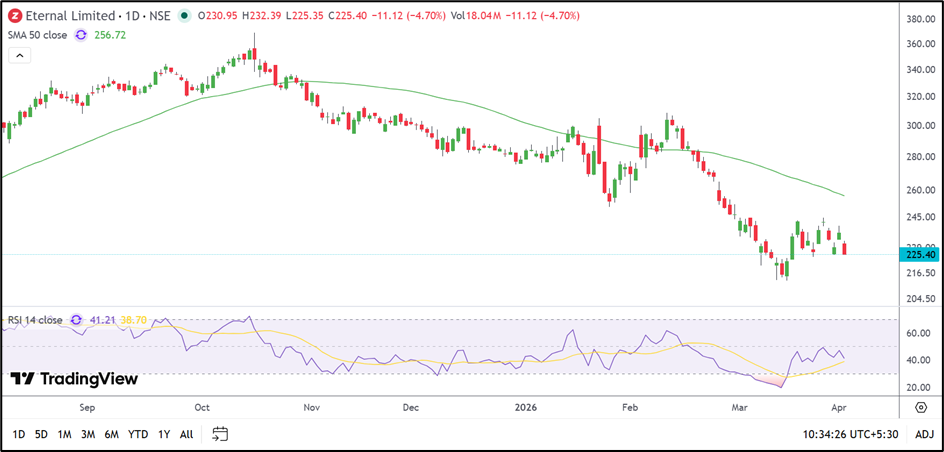
Source: TradingView
Key Risks
- Failure to hold above INR 205.00 may deepen the decline.
- Resistance near INR 250.00–275.00 may restrict recovery.
- The stock remains below its 50-day moving average.
- Elevated valuation may keep volatility high.
Summary
Eternal Limited (NSE: ETERNAL) declined 4.70% to INR 225.40 after extending its recent weakness below INR 230.00. The stock remains below its 50-day moving average near INR 256.72, while RSI near 41.21 suggests that momentum remains subdued.
FAQs
- Why did Eternal Limited shares fall today?
The stock weakened after failing to hold above INR 240.00. - What was Eternal Limited’s December quarter net profit?
The company reported consolidated net profit of INR 10,200.00 lakh. - Which levels are important for Eternal Limited shares?
Support is near INR 205.00–190.00, while resistance is around INR 250.00–275.00.