
Highlights
- FCS Software Solutions Limited shares declined 6.59% to ₹1.70 on April 13, 2026.
- The stock turned lower after a sharp rebound from its recent low near ₹1.15.
- Weak earnings and fading momentum kept pressure on the counter.
Overview
FCS Software Solutions Limited (NSE: FCSSOFT) fell 6.59% to ₹1.70 on April 13, 2026, after opening at ₹1.71 and touching an intraday low of ₹1.67. The stock slipped after witnessing a strong rally over the past few sessions.
The recent rebound had lifted the stock from around ₹1.15 to above ₹1.75 in a short period. However, the latest session suggests that the recovery may be losing pace as the stock struggles to build further strength above its recent highs.
Fundamental View
FCS Software Solutions remains under financial pressure. For the December 2025 quarter, the company reported total income of ₹778.07 lakh.
The company posted a loss before tax of ₹235.08 lakh, while net loss stood at ₹240.53 lakh. Earnings per share remained negative at ₹0.01, indicating that the recent improvement in the stock price has not been supported by a turnaround in profitability.
Technical View
FCS Software Solutions had been moving steadily higher after rebounding from its April low, but the stock appears to be pausing after a nearly vertical rise. The latest candle shows that the stock failed to hold near the ₹1.80 region and closed lower despite trading above its 50-day Simple Moving Average near ₹1.57.
The stock is still trading above the moving average, which suggests that the short-term recovery remains intact. However, the inability to sustain near the recent peak indicates that the rally is now encountering fresh supply.
The 14-day RSI is at 59.93. Momentum remains stronger than it was through most of March, but the RSI has started to cool after moving close to the 60 marks, suggesting that the pace of the recent up move may be slowing.
Key Technical Levels
The stock may find near-term support around ₹1.50–1.30 if the current decline extends. On the upside, the ₹1.90–2.15 region may remain difficult to cross unless the stock regains stronger momentum after the recent pause.
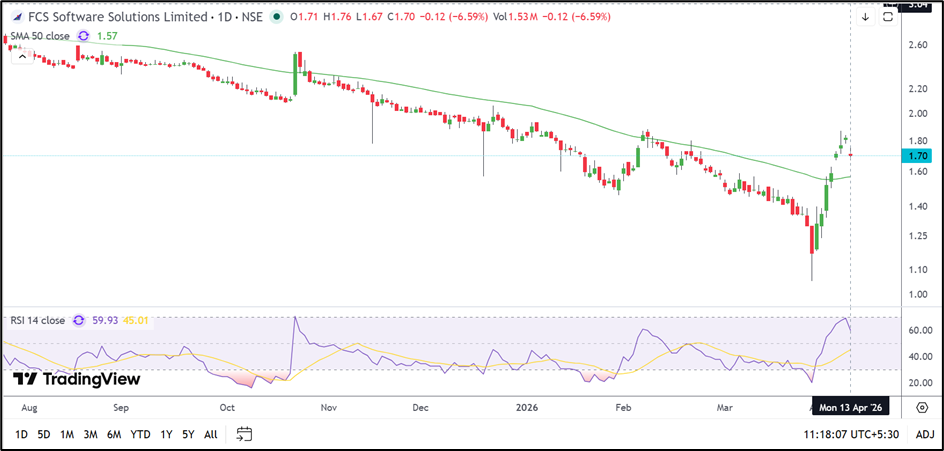
Source: TradingView
Risk to Watch
- The recent rally may weaken further if the stock slips below ₹1.50.
- Continued losses could keep sentiment fragile.
- The stock remains highly volatile because of its low price.
- Failure to move above the recent high may trigger further profit booking.
Summary
FCS Software Solutions has corrected after a sharp rebound from recent lows. While the stock is still trading above its 50-day SMA, the latest session indicates that the recent recovery may be slowing. Weak fundamentals and fading momentum could keep the stock volatile in the near term.
FAQs
Why did FCS Software Solutions share price fall today?
The stock declined after failing to sustain its recent rebound and faced pressure near its recent high.
What is the 50-day SMA for FCS Software Solutions?
The 50-day Simple Moving Average for the stock is currently near ₹1.57.
How much loss did FCS Software Solutions report in December 2025?
FCS Software Solutions reported a net loss of ₹240.53 lakh in the December 2025 quarter.