
Highlights
- Finkurve Financial stock declined over 3% intraday amid continued downtrend pressure.
- Q3 FY26 business metrics improved significantly, with AUM and customer base expanding.
- Technical indicators show weak momentum, with resistance likely near ₹62.00–₹70.00.
Shares of Finkurve Financial Services Ltd (NSE:FINKURVE) declined around 3.27% to trade near ₹55.08 on March 24, 2026, on the National Stock Exchange (NSE). The stock remains well below its 50-day Simple Moving Average of ₹78.31, indicating a weak broader trend.
The price structure continues to reflect a sustained downtrend, with a sequence of lower highs and lower lows. Recent price action shows a sharp decline followed by a brief rebound, suggesting a temporary pause rather than a confirmed recovery.
Business Expansion and Lending Profile
Finkurve Financial operates in the lending space, with a focus on secured financing segments. The company’s growth is reflected in its expanding customer base and asset portfolio.
Business expansion through branch network growth and increased disbursements indicates scaling of operations, though such growth may also involve higher leverage and associated risks.
Financial and Operational Performance
The company reported strong operational growth for Q3 FY26. Assets under management (AUM) surged 119% year-on-year to ₹833.15 crore, while disbursements increased 38% during the period.
The customer base expanded by 66%, and the branch network grew 36%, indicating continued business expansion. Gold holdings also rose 57%, reflecting increased demand in the secured lending segment.
Asset quality showed improvement, with net non-performing assets (NNPA) declining to 0.54%. This suggests strengthening in the loan portfolio despite the rapid scale-up in operations.
Trading Activity Indicates Continued Pressure
The recent decline in share price highlights ongoing selling pressure and limited buying support at current levels. The stock’s position significantly below its 50-day moving average indicates cautious participation from market participants.
Such movements are often associated with a continuation of the prevailing trend rather than a reversal.
Technical Setup Shows Weak Momentum
Finkurve Financial Services Ltd. is currently trading near ₹55.08 as of March 24, 2026, declining around 3.27% in the session and remaining well below its 50-day Simple Moving Average near ₹78.31, indicating a weak broader trend. The price structure continues to reflect a sustained downtrend with a sequence of lower highs and lower lows.
Recent price action shows a sharp decline followed by a brief rebound, suggesting a temporary pause rather than a confirmed recovery. The 14-day RSI stands near 34.05, indicating subdued momentum with mild oversold conditions. On the downside, support is placed around ₹52.00–₹48.00, while resistance is seen near ₹62.00–₹70.00 in the near term.
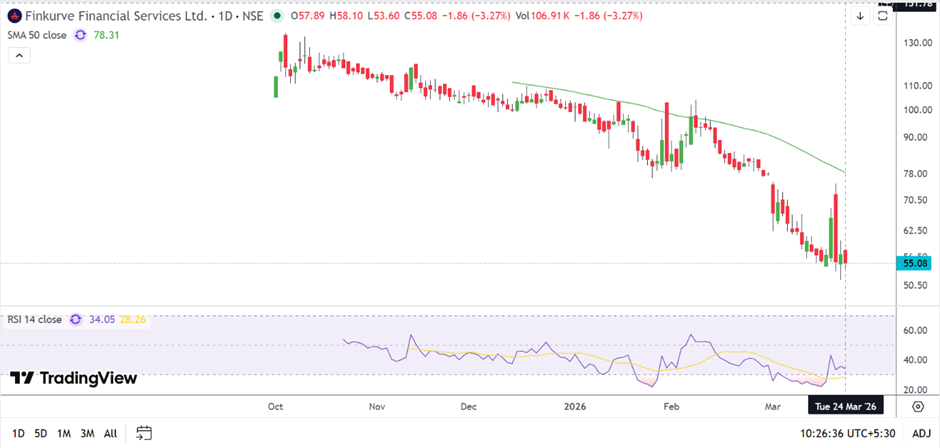
Source: TradingView
Outlook Hinges on Stabilisation and Breakout
In the near term, the stock’s direction may depend on its ability to stabilise near support levels and regain momentum. While operational performance shows growth, technical indicators continue to reflect weakness.
Market participants may monitor both price action and asset quality trends for further clarity.
Risk Factors to Watch
- Sustained downtrend with lower highs and lows limits near-term upside visibility.
· Elevated leverage and rapid expansion may introduce financial risks.
· Weak technical indicators suggest limited momentum for recovery.
Finkurve Financial Services Ltd (NSE:FINKURVE) recent decline reflects continued pressure in price action despite strong operational growth. While business metrics indicate expansion and improved asset quality, the technical structure remains weak. Sustained upside may depend on stabilisation in price trends alongside continued operational performance.
FAQs
- Why did Finkurve Financial shares fall today?
The stock declined due to ongoing downtrend pressure and weak momentum despite strong operational performance in recent results. - What are the key resistance levels for Finkurve Financial stock?
The stock faces resistance between ₹62.00 and ₹70.00, which may limit near-term upside movement. - How did Finkurve Financial perform in Q3 FY26?
The company reported strong growth in AUM, disbursements, and customer base, along with improved asset quality metrics.