
Highlights
- Gland Pharma shares surged nearly 13% after the company announced Q4 FY26 earnings.
- Net profit and revenue growth supported positive market reaction in the pharma counter.
- The stock moved above key moving average levels with RSI entering the overbought zone.
Overview
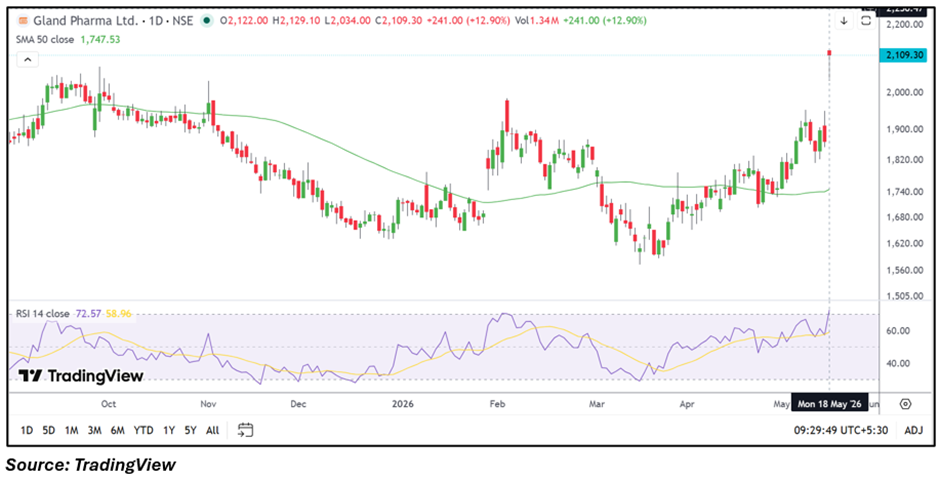
Gland Pharma Limited (NSE: GLAND) witnessed strong buying activity during Monday’s trading session, with the stock rising nearly 13% to around INR 2,109.50. The rally followed the company’s Q4 FY26 earnings announcement released after market hours on May 15.
The stock opened sharply higher at INR 2,122.00 and touched an intraday high of INR 2,129.10 before witnessing mild profit booking. Gland Pharma also emerged among the top gaining pharma stocks during the session as investors reacted positively to the quarterly performance.
Fundamental View
For the quarter ended March 2026, Gland Pharma reported standalone total income of INR 1,36,794.90 lakh. Profit before tax stood at INR 56,479.90 lakh, while net profit came in at INR 42,045.10 lakh. Earnings per share for the quarter was reported at INR 25.52.
The earnings performance supported improved sentiment around the stock after recent consolidation phases seen across several pharmaceutical counters. Market participants appeared encouraged by the company’s profitability and quarterly growth trajectory.
Technical View
Gland Pharma stock traded near INR 2,109.50, up 12.91% in the session. The stock remained comfortably above its 50-day SMA near INR 1,747.53, indicating a positive near-term structure after the sharp upward move.
Price action reflects a strong breakout from recent consolidation zones, while the 14-day RSI climbed near 72.57, suggesting momentum has strengthened and entered the overbought region. The stock also witnessed a notable increase in trading activity alongside the price surge.
Key Technical Levels
- Immediate Support: INR 2,010–1,900
- Immediate Resistance: INR 2,230–2,380
Risks to Watch
- Overbought RSI levels may trigger short-term volatility.
- Pharma sector sentiment could remain sensitive to earnings trends.
- Failure to sustain above breakout levels may impact momentum.
- Margin pressure and export-related risks remain key monitorables.
Summary
Gland Pharma shares rallied sharply after the company reported its Q4 FY26 earnings, with investors reacting positively to the quarterly numbers. The stock witnessed strong momentum and moved above important technical levels during the session. While the near-term structure has improved significantly, traders may continue monitoring resistance zones and earnings sustainability in the coming sessions.
FAQs
Why did Gland Pharma shares rise today?
The stock gained after the company reported Q4 FY26 earnings and improved profitability.
What was Gland Pharma’s Q4 FY26 net profit?
The company reported standalone net profit of INR 42,045.10 lakh for the quarter.
What are the important levels for Gland Pharma stock?
Support is placed near INR 2,010–1,900, while resistance is seen around INR 2,230–2,380.