
Highlights
- GNG Electronics Ltd (NSE: GNG) fell 10.00% to ₹374.10 in Wednesday’s session.
- The stock slipped below its 21-day SMA of ₹387.83 after facing selling pressure near recent highs.
- GNG Electronics reported standalone net profit of ₹984.80 lakh in the December 2025 quarter.
Overview
GNG Electronics Ltd (NSE: GNG) declined 10.00% to ₹374.10 after opening at ₹403.20 and touching an intraday high of ₹410.00. The stock remained under pressure through the session and eventually closed at the day’s low.
The decline comes after a sharp rally in recent weeks that had pushed the stock close to the ₹435.00 zone. However, the latest session suggests that the stock is now facing resistance after the recent rebound.
Fundamental View
For the quarter ended December 2025, GNG Electronics reported standalone total income of ₹22,750.80 lakh.
Profit before tax stood at ₹1,338.90 lakh, while net profit came in at ₹984.80 lakh. Earnings per share was ₹0.86.
The company remained profitable in the latest quarter, though earnings appear modest relative to the stock’s recent sharp rise.
Technical View
GNG Electronics has slipped below its 21-day Simple Moving Average of ₹387.83, indicating that near-term momentum has weakened.
The stock had rallied sharply over the past few weeks but failed to sustain near the upper band around ₹435.60–450.90. As a result, the price has turned lower and is now trading below this resistance zone.
The 14-day RSI has dropped to 46.40 after cooling from higher levels, suggesting that momentum has moderated significantly. The indicator is no longer in overbought territory, but the latest weakness indicates that the stock may remain under pressure unless it quickly regains lost ground.
Key Technical Levels
The ₹345.25–315.35 region may now act as the first support zone if the correction continues. A move below ₹345.25 could increase the possibility of a deeper decline toward the lower end of this band.
On the upside, the stock is likely to continue facing resistance around ₹435.60–450.90. Unless GNG Electronics moves back above this region, the present pullback may continue.
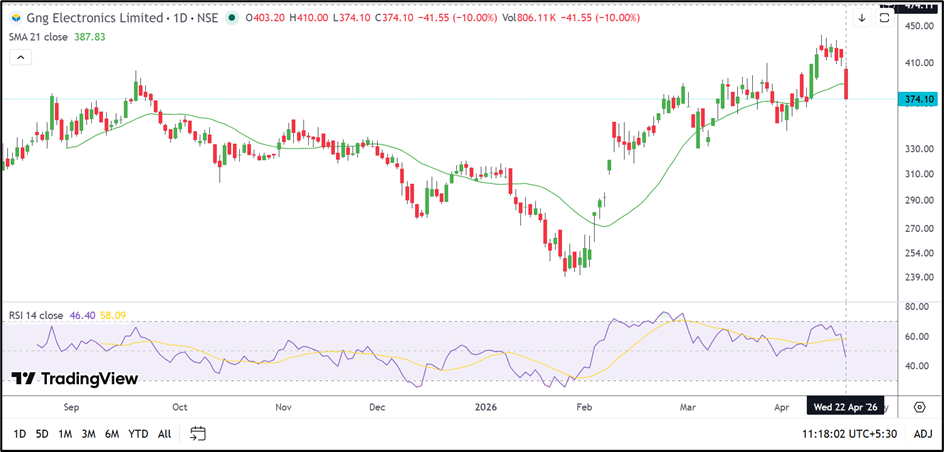
Source: TradingView
Risks to Watch
- The stock has broken below its 21-day SMA, which weakens the near-term structure.
- Failure to hold above ₹345.25 may increase downside pressure.
- GNG Electronics has seen large price swings over the past three months and may remain highly volatile.
- The stock continues to trade at a relatively elevated valuation.
Summary
GNG Electronics Ltd (NSE: GNG) has come under pressure after failing to sustain near recent highs. The stock is now trading below its 21-day SMA and appears to be facing resistance near the recent peak zone.
The next few sessions may decide whether the stock stabilises near ₹345.25 or continues to weaken further while remaining below the ₹435.60–450.90 band.
FAQs
Why did GNG Electronics share price fall today?
The stock declined after facing resistance near recent highs and slipping below its 21-day SMA.
Is GNG Electronics trading below its 21-day SMA?
Yes. GNG Electronics is currently trading below its 21-day SMA of ₹387.83.
What are the next key levels for GNG Electronics?
The stock may find support near ₹345.25–315.35, while resistance is placed around ₹435.60–450.90.