
Highlights
- GRM Overseas shares declined more than 8% and hit multi-month lows.
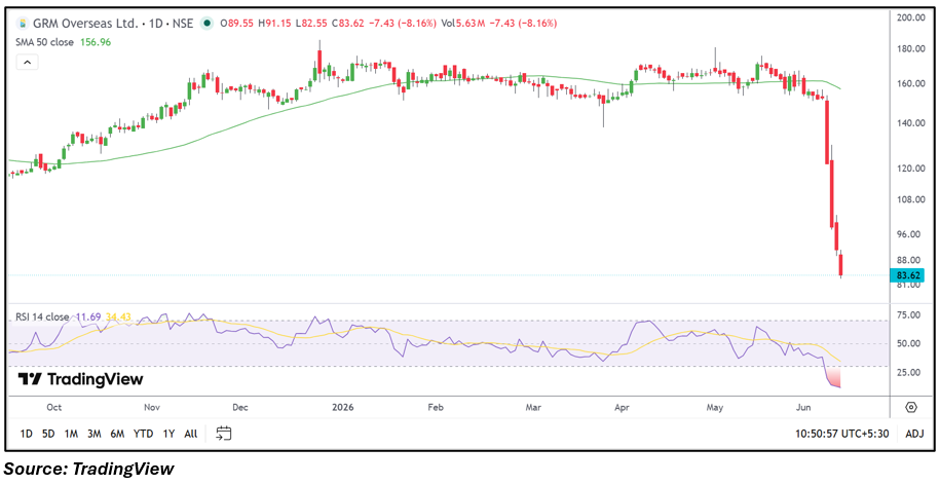
- The stock trades well below its 50-day SMA, reflecting persistent weakness.
- RSI slipped near oversold territory, indicating stretched downside momentum.
Overview
GRM Overseas Limited (NSE: GRMOVER) remained under pressure on June 11, with the stock falling 8.02% to ₹83.75. The sharp decline came despite the company reporting a profitable fourth quarter, highlighting that market sentiment currently remains focused on technical weakness rather than recent earnings performance. The stock has witnessed sustained selling pressure in recent sessions, pushing it toward multi-month lows and placing it among the notable losers of the day.
Fundamental View
For the quarter ended March 2026, GRM Overseas reported consolidated total income of ₹60,679.20 lakh. Profit before tax stood at ₹3,132.81 lakh, while net profit came in at ₹2,160.95 lakh. Earnings per share were reported at ₹2.35.
While the company continues to remain profitable, investors appear concerned about the stock's valuation reset and weakening price trend. The absence of any major positive trigger has kept sentiment subdued despite stable financial performance.
Technical View
GRM Overseas is currently trading at ₹83.75, down 8.02% for the session and significantly below its 50-day SMA of ₹156.96. The stock has broken below several recent trading zones and continues to form a lower-high, lower-low structure on the daily chart. Price action suggests sellers remain in control as the stock extends its sharp correction from previous highs.
Momentum Indicator
The 14-day RSI has dropped to 11.69, placing the stock deep in oversold territory. While such readings can occasionally trigger short-term rebounds, they also reflect the intensity of the recent decline. Momentum remains weak until sustained stabilization emerges.
Key Technical Levels
On the downside, immediate support is seen near ₹82.50, followed by a broader support zone around ₹75.00. On the upside, any recovery attempt may face resistance near ₹91.00, while a stronger hurdle is placed around ₹100.00, where selling pressure could re-emerge.
Risks to Watch
- Continued weakness below the 50-day SMA.
- High volatility following sharp price declines.
- Lack of fresh positive business catalysts.
- Broader market risk-off sentiment.
Summary
GRM Overseas shares remain under significant pressure as the stock trades well below its 50-day SMA and near oversold RSI levels. Although the company reported profits in the latest quarter, technical factors currently dominate sentiment. Investors may watch whether the stock stabilizes near current levels or extends its correction toward lower support zones.
FAQs
- Why did GRM Overseas shares fall today?
The stock declined sharply amid persistent selling pressure and weakening technical momentum despite reporting profits. - Is GRM Overseas profitable?
Yes, the company reported a consolidated net profit of ₹2,160.95 lakh for the March 2026 quarter. - What does the RSI indicate currently?
The RSI near 11.69 suggests the stock is in oversold territory after a steep decline.