
Highlights
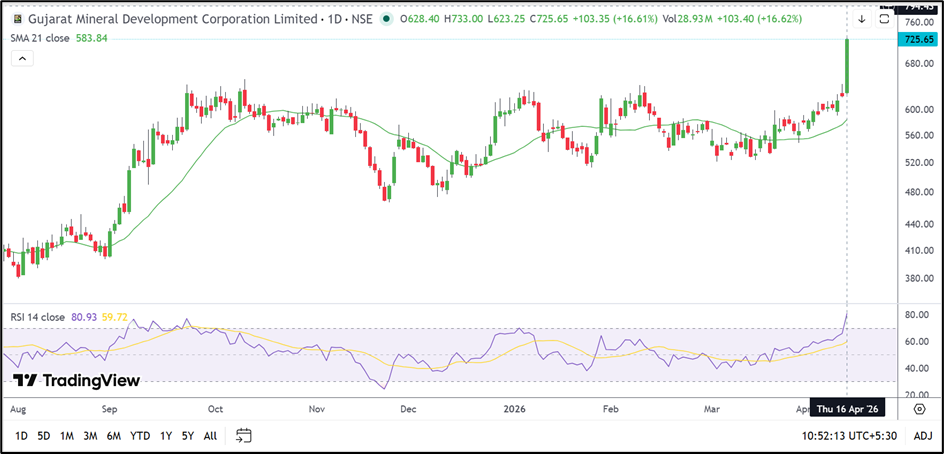
- Gujarat Mineral Development Corporation Limited jumped 16.62% to ₹725.65 on April 16, 2026.
- The stock burst above its recent consolidation range and climbed to a fresh 52-week high near ₹733.
- GMDC is now trading sharply above its 21-day SMA of ₹583.84.
Overview
Gujarat Mineral Development Corporation Limited (NSE: GMDC) surged 16.62% to ₹725.65 after opening at ₹628.40 and touching an intraday high of ₹733.00. The move came after several sessions of narrow consolidation between ₹560 and ₹620, where the stock had been quietly building strength.
The latest breakout has pushed GMDC into a fresh price discovery phase. Unlike earlier rallies that paused near previous highs, this move has carried the stock decisively above every major swing level seen over the past year.
Fundamental View
For the quarter ended December 2025, GMDC reported standalone total income of ₹68,043 lakh.
Profitability remained robust during the quarter. Profit before tax stood at ₹18,151 lakh, while net profit came in at ₹13,515 lakh. Earnings per share was reported at ₹4.25.
The strong quarterly numbers indicate that the recent rally is not based only on technical momentum. The stock is also being supported by a healthy earnings profile and a strong operational backdrop.
Technical View
The technical structure has changed sharply over the last few sessions. After spending nearly two months moving sideways, GMDC has suddenly expanded out of that range with a large bullish candle and exceptionally strong follow-through.
The stock is now trading far above its 21-day Simple Moving Average near ₹583.84, confirming that the short-term trend remains firmly positive. More importantly, the breakout has come after a long period of consolidation, which often leads to a stronger directional move once resistance is crossed.
Momentum indicators also point to an overheated but still active trend. The 14-day RSI has climbed to 80.93, which places the stock in deep overbought territory. While that may trigger short-term volatility or a pause, the broader structure still remains constructive as long as the breakout zone holds.
Key Technical Levels
The ₹680–620 area may now act as the first support band if the stock witnesses some profit booking after the sharp rally. On the upside, the next zone to watch is ₹800–850, where the stock may face the next major supply area if the momentum continues.
Source: TradingView
Risk to Watch
- The RSI has moved above 80, indicating stretched near-term momentum.
- A rapid move after a long rally can sometimes lead to sharp pullbacks.
- Failure to hold above ₹680 may weaken the breakout pattern.
- Commodity-linked stocks can remain highly volatile during strong upswings.
Summary
GMDC has moved out of a long consolidation phase and entered a fresh upward leg. The combination of strong earnings and a decisive breakout has shifted the stock into a new price zone. The next few sessions may determine whether the stock can extend toward the ₹800 region or first cool off after the recent vertical rise.
FAQs
Why did GMDC share price jump today?
GMDC surged after breaking above its recent trading range and moving into a fresh 52-week high zone.
Is GMDC trading above its short-term average?
Yes. GMDC is trading significantly above its 21-day SMA of ₹583.84.
What were GMDC's December 2025 quarterly results?
GMDC reported total income of ₹68,043 lakh and net profit of ₹13,515 lakh for the December 2025 quarter.