
Highlights
- STL Networks shares hit a 10% decline after FY26 earnings announcement.
- March quarter losses and weak sentiment weighed heavily on the stock.
- The stock slipped sharply despite recent recovery seen in telecom-related counters.
Overview
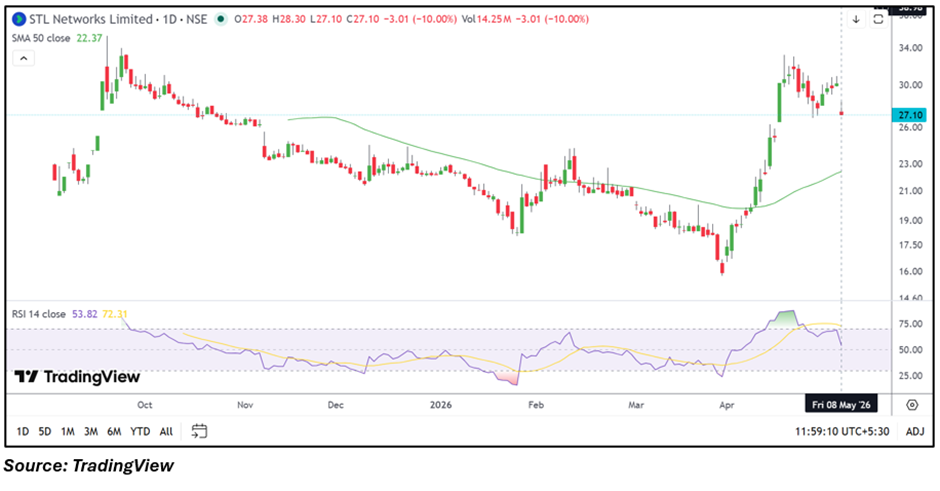
STL Networks (NSE: STLNETWORK) came under significant selling pressure on May 8, 2026, with the stock falling 10% to ₹27.10 during the session. The stock opened at ₹27.38 against the previous close of ₹30.11 and touched an intraday low of ₹27.10.
The decline followed the company’s FY26 earnings update and pushed the stock among the major laggards in the broader telecom and networking segment.
Fundamental View
For the quarter ended March 31, 2026, STL Networks reported consolidated total income of INR 20,476.00 lakh. The company posted a loss before tax of INR 4,972.00 lakh, while consolidated net loss stood at INR 4,689.00 lakh. Earnings per share for the quarter came at negative INR 0.96.
Market participants continue monitoring profitability trends, debt-related pressures, telecom infrastructure demand, order execution visibility, and cash flow stability across operations.
Technical View
STL Networks is trading near ₹27.10, down 10%, and remains above its 50-day SMA around ₹22.37, indicating that the broader recovery structure has not fully broken down despite the sharp decline.
However, price action reflects aggressive selling after the stock failed to sustain near recent highs around the ₹30 zone. The latest move also weakened near-term sentiment significantly.
Momentum Indicator
The 14-day RSI cooled near 53.82 after previously moving into elevated territory during the recent rally phase. The sharp drop indicates fading momentum and increased volatility following the earnings reaction.
Key Technical Levels
- Immediate Support: ₹25.00
- Secondary Support: ₹23.00
- Immediate Resistance: ₹27.00
- Higher Resistance: ₹30.00
Risks To Watch
- Continued losses may pressure investor sentiment further.
- Weak telecom spending can affect revenue visibility.
- Volatility may remain elevated after the sharp correction.
- Sustaining above ₹25 remains important technically.
Summary
STL Networks shares declined sharply after FY26 earnings showed continued losses, triggering heavy selling pressure in the stock. While the broader recovery trend remains partly intact above the 50-day SMA, near-term sentiment weakened considerably following the post-results reaction. Traders may continue monitoring whether the stock stabilizes near ₹25 while attempting to reclaim the ₹27–₹30 zone.
FAQs
Why did STL Networks shares fall sharply today?
The stock declined after FY26 earnings reported continued losses and triggered weak market sentiment.
What are the key support levels for STLNETWORK?
Immediate support is placed near ₹25, while the next important support zone is around ₹23.
Why is RSI important for STL Networks currently?
RSI near 54 reflects cooling momentum after the sharp post-earnings correction in the stock.