
Highlights
- Hindustan Oil Exploration (NSE: HINDOILEXP) declined 7.29% during Wednesday's session.
- The stock slipped below its 50-day SMA after failing to hold recent gains.
- Weak momentum and a lower high structure point to near-term pressure.
Fundamental View
Hindustan Oil Exploration (NSE: HINDOILEXP) reported a stable December 2025 quarter despite recent weakness in the share price. Consolidated total income stood at ₹7,910.64 lakh, while profit before tax came in at ₹685.83 lakh. Net profit was reported at ₹827.56 lakh and earnings per share stood at ₹0.63.
The company remains profitable, but the latest quarterly performance has not been strong enough to support the sharp swings seen in the stock during the last few weeks. That has increased the possibility of continued volatility in the near term.
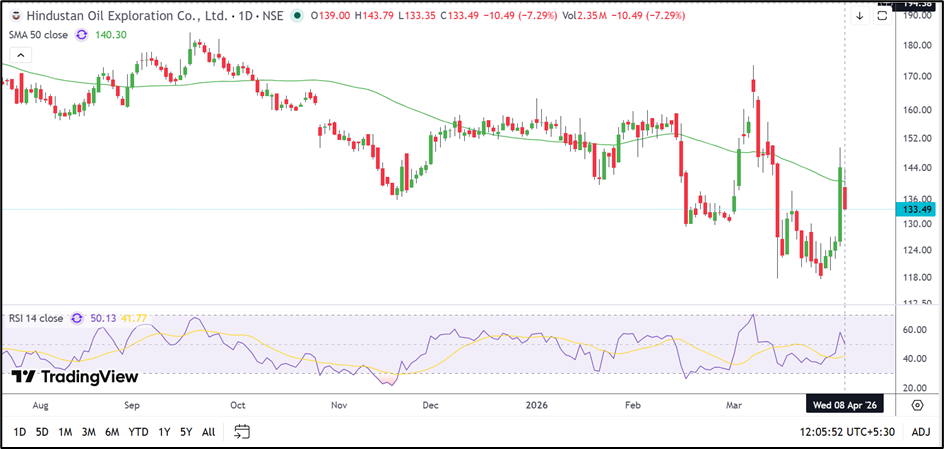
Technical View
Hindustan Oil Exploration (NSE: HINDOILEXP) is currently trading near ₹133.49, down 7.29% in the session. The stock has also slipped below its 50-day Simple Moving Average near ₹140.30, indicating that the broader trend has weakened.
The chart reflects a volatile structure over the last two months. After a brief rebound from the ₹120 zone, the stock attempted to move back above ₹145 but failed to sustain the rise. Wednesday's sharp decline erased most of the recent recovery and pushed the stock back below the moving average.
The RSI is near 50.13, which suggests momentum has turned neutral after failing to hold above stronger readings seen earlier. The stock no longer shows strong upward momentum and may remain under pressure unless it quickly recovers above the 50-day average.
Momentum Indicator
The latest fall suggests that sellers remain active on every rebound. Unless the stock stabilises soon, the recent decline may extend into a broader corrective phase.
Key Technical Levels
The immediate downside zone is placed between ₹125.00 and ₹117.00. A break below this band may expose the stock to further weakness.
On the upside, Hindustan Oil Exploration (NSE: HINDOILEXP) could face renewed pressure between ₹145.00 and ₹165.00, where previous rallies have struggled.
Source: TradingView
Key Risks
- The stock has fallen below its 50-day SMA.
- Repeated failures near higher levels indicate weak momentum.
- Volatility remains high after recent sharp price swings.
- A move below ₹125 may deepen the correction.
Summary
Hindustan Oil Exploration (NSE: HINDOILEXP) has turned weaker after slipping below its 50-day average. The broader structure now appears fragile, and the stock may need to reclaim higher levels before confidence returns.
FAQs
- Why did Hindustan Oil Exploration share price fall today?
The stock declined after failing to sustain its recent rebound and slipped below the 50-day SMA. - Is Hindustan Oil Exploration still above its 50-day SMA?
No, the stock is now trading below its 50-day SMA of around ₹140.30. - What should traders monitor next?
Traders may watch whether the stock holds above ₹125 and whether it can move back above the 50-day SMA.