
Highlights
- Hybrid Financial Services Ltd stock declined nearly 5% in the latest trading session.
- RSI remained below 35, indicating persistent selling pressure without clear reversal signals.
- Price continues trading below 51-period SMA, reinforcing prevailing bearish trend structure.
Shares of Hybrid Financial Services (NSE:HYBRIDFIN) were trading at ₹15.64 on March 27, 2026, registering a decline of 4.98% on the National Stock Exchange of India. The stock has been in a sustained downtrend since peaking near ₹30.00 in late 2025.
The broader price structure reflects a consistent pattern of lower highs and lower lows, indicating continued selling pressure. The stock is currently trading below its 51-period Simple Moving Average (SMA) at ₹18.99, which continues to act as a dynamic resistance level. The inability to reclaim this level suggests that the medium-term trend remains bearish.
Momentum Indicators Reflect Weakness
The Relative Strength Index (RSI 14) is currently at 34.99, remaining below its signal line at 35.63. This indicates ongoing weakness in momentum, with selling pressure still dominating price action.
Although the RSI is approaching the oversold threshold of 30, it has not yet reached levels typically associated with potential reversals. Additionally, there are no visible signs of bullish divergence, further indicating the absence of immediate recovery signals.
Volume Analysis Signals Limited Buying Interest
Trading volume stands at 5.38K, reflecting relatively low market participation. Notably, recent upward price movements have not been supported by strong volume expansion, suggesting limited buying conviction at current levels.
The lack of volume spikes on green candles indicates that any short-term upward moves may face difficulty sustaining without stronger participation.
Key Technical Levels
Trading ₹15.64, the stock is positioned within a defined trading range, with immediate support at ₹14.08 and stronger backing at ₹13.29, which may act as accumulation zones on dips. On the upside, resistance levels at ₹17.20 and ₹17.99 could cap near-term advances.
The setup indicates consolidation, where price action may remain range-bound unless a decisive breakout above ₹17.20 or breakdown below ₹14.08 occurs.
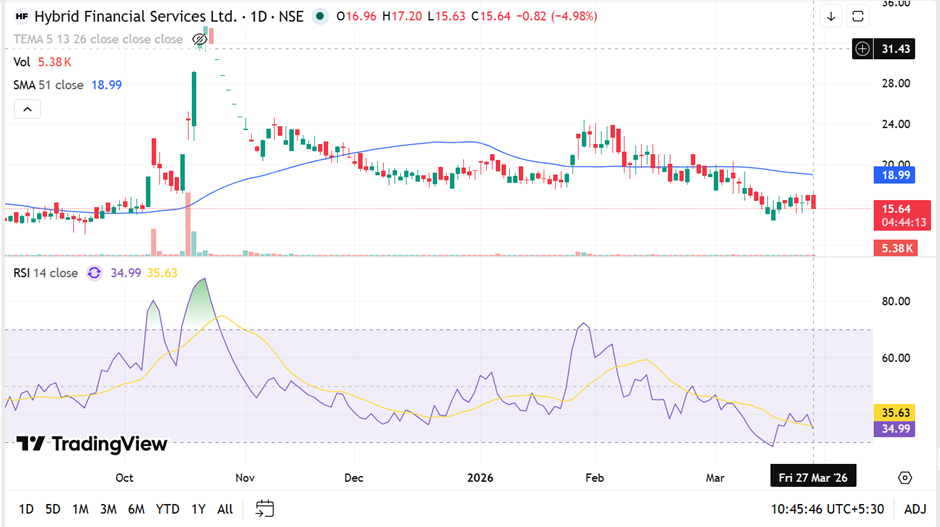
Source: TradingView
Key Risks
- Continued trading below SMA may extend bearish trend.
- RSI not yet oversold may allow further downside movement.
- Low volume reduces probability of sustained recovery.
- Failure to hold ₹14 support could accelerate declines.
Summary
Hybrid Financial Services stock declined nearly 5% in the latest session, continuing its broader bearish trend. The price remains below its 51-period SMA, reinforcing resistance in the medium term. RSI near 35 indicates persistent selling pressure, while low trading volumes highlight limited buying interest. Key support and resistance levels will be important in determining the stock’s near-term direction.
FAQs
- Why is Hybrid Financial Services stock declining?
The stock is in a sustained downtrend with consistent lower highs and lows, reflecting ongoing selling pressure in the market. - What does the RSI indicate for the stock?
RSI near 35 suggests weak momentum and continued selling pressure, without reaching oversold levels that typically signal reversals. - What are the key levels to watch for this stock?
Resistance levels are ₹17.20 and ₹17.99, while support levels are ₹14.08 and ₹13.29.