
Highlights
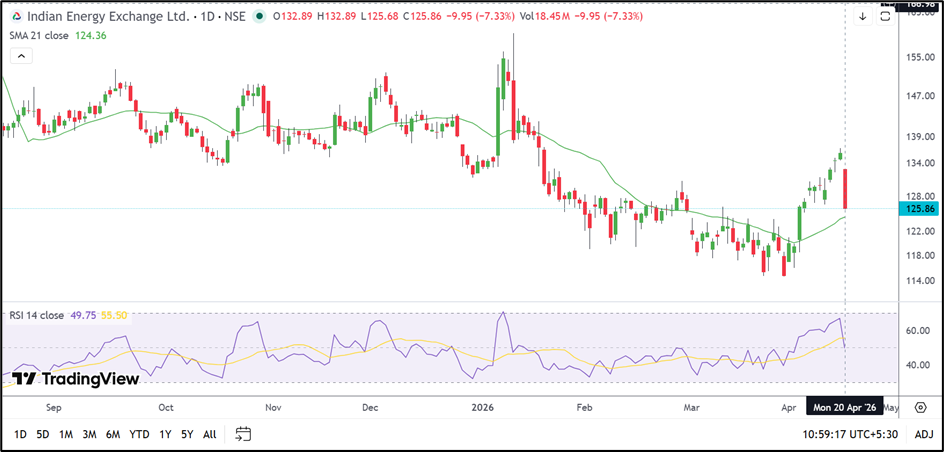
- Indian Energy Exchange Ltd (NSE: IEX) dropped 7.36% to ₹125.81 after slipping from an intraday high of ₹132.89.
- The stock has fallen back near its 21-day SMA of ₹124.36 after a failed breakout attempt above ₹135.00.
- Support is placed at ₹115.00–₹108.00, while resistance is seen near ₹135.00–₹146.00.
Overview
Indian Energy Exchange Ltd (NSE: IEX) declined 7.36% to ₹125.81 on 20-Apr-2026 after opening at ₹132.89. The stock touched an intraday low of ₹125.68 and emerged among the weakest performers in the session.
The sharp fall came after IEX failed to sustain its recent move above the ₹135.00 zone. The stock had rallied strongly over the previous few sessions, but the latest decline indicates that the breakout attempt has weakened.
Fundamental View
For the quarter ended December 2025, Indian Energy Exchange Ltd (NSE: IEX) reported consolidated total income of ₹18,306.48 lakh.
Profit before tax stood at ₹15,276.29 lakh, while net profit came in at ₹11,910.52 lakh. Earnings per share was ₹1.34.
The company continues to report strong profitability despite the recent weakness in the share price. However, the latest price action suggests that traders are reacting more to near-term technical factors than to the company’s underlying earnings profile.
Technical View
IEX is still trading marginally above its 21-day SMA of ₹124.36, but the latest candle has weakened the short-term setup. The stock briefly moved above ₹135.00 in recent sessions before reversing sharply, which often reflects exhaustion after a fast rebound.
The 14-day RSI has slipped to 49.75 from higher levels, indicating that momentum has cooled meaningfully. The decline in RSI suggests that the earlier upward move has lost pace, and the stock may now enter a broader consolidation phase.
Key Technical Levels
The ₹115.00–₹108.00 area may now act as the next important support zone if the selling pressure continues. On the upside, IEX may face resistance near ₹135.00–₹146.00, which is the same region where the recent rally stalled. Holding above the 21-day SMA of ₹124.36 may help the stock stabilise in the near term.
Source: TradingView
Risks to Watch
- A close below ₹124.00 may weaken the short-term structure further.
- Continued rejection near ₹135.00 could keep the stock under pressure.
- The recent failed breakout may lead to a longer consolidation phase.
- A fall below ₹115.00 could increase downside risk toward lower levels.
Summary
Indian Energy Exchange Ltd (NSE: IEX) has lost momentum after failing to sustain its recent breakout above ₹135.00. While the company’s quarterly numbers remain strong, the technical picture has weakened in the near term. The stock may remain under pressure unless it regains the ₹135.00 zone.
FAQs
Why did Indian Energy Exchange share price fall today?
Indian Energy Exchange Ltd (NSE: IEX) declined after failing to hold above the recent breakout zone near ₹135.00.
What are the key support levels for IEX?
The immediate support zone is placed between ₹115.00 and ₹108.00.
What is the next resistance area for IEX shares?
The next resistance zone is placed near ₹135.00–₹146.00.