
Highlights
- Indiqube Spaces Limited shares surged 20.00% to ₹185.48 on April 16, 2026.
- The stock moved sharply higher after building a recovery pattern through early April.
- Price has now climbed well above the 21-day SMA near ₹146.46.
Overview
Indiqube Spaces Limited (NSE: INDIQUBE) rallied 20.00% to ₹185.48 on April 16, 2026, after opening at ₹170.00. The stock touched an intraday low of ₹163.10 before witnessing strong buying through the session and eventually locking at the day’s high.
The latest move comes after a sharp turnaround from the March low near ₹135.00. Over the last few weeks, the stock had gradually started making higher lows, suggesting that downside pressure was easing. The latest session accelerated that trend and pushed the stock into a fresh breakout zone.
Fundamental View
For the quarter ended December 2025, Indiqube Spaces reported standalone total income of ₹41,109.10 lakh.
However, profitability remained under pressure. The company reported a loss before tax of ₹2,310.10 lakh, while net loss stood at ₹1,706.70 lakh. Earnings per share was negative at ₹0.81.
The rally therefore appears to be driven primarily by technical momentum and a rapid change in market sentiment rather than a near-term improvement in financial performance.
Technical View
The latest chart structure stands out because the stock has not only broken above recent highs but has done so after spending several weeks quietly building a base.
Unlike earlier rebound attempts that faded near the 21-day SMA, this time the stock accelerated sharply once it crossed that average. Indiqube Spaces is now trading well above its 21-day Simple Moving Average near ₹146.46, which indicates that the near-term trend has shifted decisively.
The stock has also cleared the swing-high region from late February and early March in a single move. Meanwhile, the 14-day RSI has climbed to 71.71, placing the stock in overbought territory. That suggests momentum remains very strong, although some pause or consolidation may emerge after such a steep rally.
Key Technical Levels
The ₹175.00–163.00 zone may now act as the first support area if the stock sees some profit booking after the breakout. On the upside, the next resistance band may emerge around ₹200.00–215.00 if the current momentum continues.
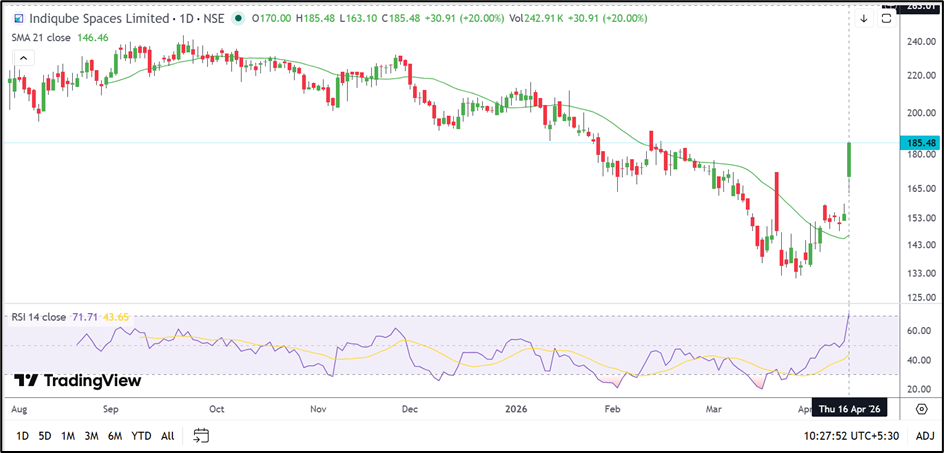
Source: TradingView
Risk to Watch
- The stock has entered overbought territory after the sharp one-day rise.
- Indiqube Spaces continues to report losses despite the breakout.
- A move back below the recent breakout zone may weaken the recovery pattern.
- Strong momentum rallies can sometimes lead to sharp short-term pullbacks.
Summary
Indiqube Spaces has shifted from a gradual recovery into a much stronger breakout phase. The stock has reclaimed multiple earlier swing highs and is now trading far above its short-term average. While the momentum remains positive, the speed of the move suggests that the next few sessions may determine whether the rally can sustain or enters a consolidation phase.
FAQs
Why did Indiqube Spaces share price jump today?
The stock rallied sharply after breaking above its recent recovery range and witnessing strong momentum through the session.
What is the 21-day SMA for Indiqube Spaces?
The 21-day Simple Moving Average for Indiqube Spaces is currently near ₹146.46.
Did Indiqube Spaces report a profit in the December 2025 quarter?
No. Indiqube Spaces reported a standalone net loss of ₹1,706.70 lakh in the December 2025 quarter.