
Highlights
- Indosolar Ltd (NSE: INDOSOLAR) declined 4.99% to ₹513.85 after failing to hold above the ₹520.00 mark.
- The stock continues to trade comfortably above its 21-day SMA of ₹423.35 despite the latest pullback.
- Indosolar reported standalone net profit of ₹4,147.01 lakh for the December 2025 quarter.
Overview
Indosolar Ltd (NSE: INDOSOLAR) fell 4.99% to ₹513.85 after opening at ₹522.00 and touching an intraday high of ₹527.70. The stock remained under pressure through the session and eventually closed at the day’s low.
The decline comes after a powerful rally that lifted the stock from the ₹300.00 zone in March to above ₹540.00 in April. Even after the latest weakness, Indosolar remains one of the stronger-performing names in the broader market.
Fundamental View
For the quarter ended December 2025, Indosolar reported standalone total income of ₹19,969.89 lakh.
Profit before tax stood at ₹6,167.65 lakh, while net profit came in at ₹4,147.01 lakh. Earnings per share was ₹9.97.
The company’s latest quarterly performance remains strong, with healthy profitability supporting the sharp improvement in the share price.
Technical View
Indosolar is still trading well above its 21-day Simple Moving Average of ₹423.35, suggesting that the broader uptrend remains intact.
However, the stock has started to slow after approaching the ₹540.00–550.00 area. The latest session indicates that some profit-booking has emerged following the steep rally over the past few weeks.
The 14-day RSI stands at 70.16, which keeps the stock near overbought territory. Although the trend remains positive, such elevated RSI readings often lead to short periods of consolidation before the next directional move.
Key Technical Levels
The ₹475.00–450.00 band may now act as the first important support region if the current pullback extends further. As long as Indosolar remains above this zone, the broader structure may continue to stay constructive.
On the upside, the next resistance area is placed near ₹565.00–590.00. A decisive move above ₹565.00 could reopen the possibility of another upward leg.
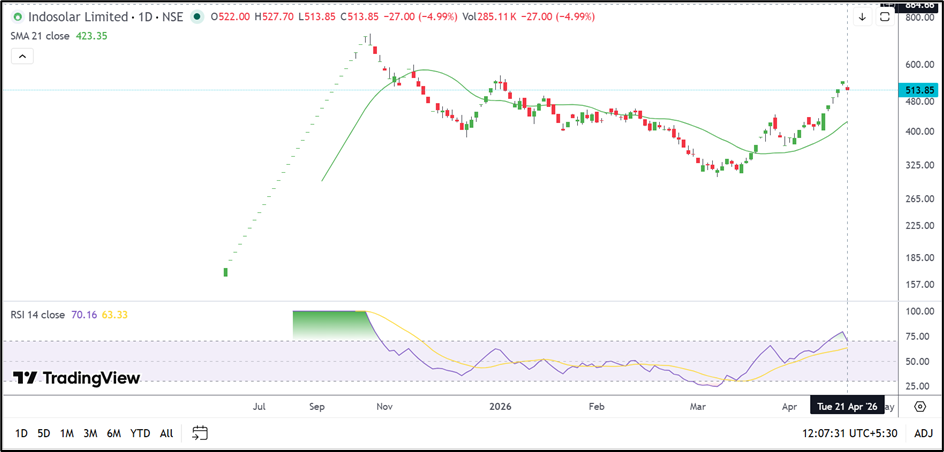
Source: TradingView
Risks to Watch
- The stock has rallied sharply in a short period, which increases the chances of near-term profit-booking.
- RSI is hovering near 70.00, indicating that momentum has become stretched.
- Failure to hold above ₹475.00 may weaken the present uptrend.
- Indosolar remains a highly volatile stock and may continue to witness wide price swings.
Summary
Indosolar Ltd (NSE: INDOSOLAR) has paused after a powerful rally, but the broader trend still remains positive. The stock is trading comfortably above its 21-day SMA and continues to be supported by strong quarterly earnings.
The next few sessions may decide whether the stock resumes its uptrend toward ₹565.00–590.00 or enters a deeper consolidation phase near ₹475.00–450.00.
FAQs
Why did Indosolar share price fall today?
The stock slipped after a strong rally in recent weeks, with some profit-booking emerging near the ₹540.00 zone.
Is Indosolar still trading above its 21-day SMA?
Yes. Indosolar is trading well above its 21-day SMA of ₹423.35.
What are the next key levels for Indosolar?
The stock may find support near ₹475.00–450.00, while the next resistance area is around ₹565.00–590.00.