
Highlights
- AksharChem India Ltd. declined around 7.01% in the latest session, reflecting continued weakness in price action.
- The stock remains well below its 50-day Simple Moving Average near ₹208.24, indicating a sustained bearish broader trend.
- Technical indicators suggest deeply oversold conditions, with RSI near 26.42, though no reversal confirmation yet.
Shares of AksharChem India (NSE:AKSHARCHEM) fell nearly 7.01% to trade near ₹161.16 as of March 25, 2026, extending its weak trend and reinforcing the ongoing corrective phase. The stock continues to remain significantly below its 50-day Simple Moving Average of ₹208.24, confirming sustained downside pressure in the broader structure. The overall price action continues to reflect a pattern of lower highs and lower lows, indicating that bearish momentum remains intact despite oversold technical conditions.
Financial Performance Shows Profit Reversal
AksharChem India Ltd. reported a weak performance in Q3 FY26, with profitability turning negative on a quarterly basis. Total income stood at ₹8,042.41 lakh compared to ₹9,075.08 lakh in Q3 FY25, reflecting a year-on-year decline in revenue. The company posted a loss of ₹461.56 lakh compared to a profit of ₹119.05 lakh in the same quarter last year, indicating a sharp deterioration in earnings performance. On a nine-month basis, profit also declined to ₹527.36 lakh loss compared to a profit of ₹338.33 lakh in the previous period, highlighting continued pressure on operational performance.
Revenue and Expense Trends
Revenue from operations declined to ₹8,037.87 lakh from ₹9,068.58 lakh year-on-year, reflecting weaker demand conditions. On the cost side, total expenses increased to ₹8,349.40 lakh, driven by higher input costs, power & fuel expenses, finance costs, and depreciation. This rise in expenses further impacted margins. Finance costs increased to ₹185.29 lakh, adding pressure on profitability, while depreciation and other expenses remained elevated, contributing to overall loss-making performance.
Technical Setup Shows Oversold Conditions
AksharChem India Ltd. is currently trading near ₹161.16 as of March 25, 2026, declining around 7.01%, reflecting continued weakness in price action. The stock remains well below its 50-day Simple Moving Average near ₹208.24, indicating a weak broader structure with sustained downward pressure.
The chart shows a clear sequence of lower highs and lower lows, highlighting an ongoing corrective phase. The 14-day RSI near 26.42 signals deeply oversold conditions, though no clear reversal is visible yet. In the near term, support is placed around ₹150.00–₹140.00, while resistance is seen near ₹180.00–₹200.00.
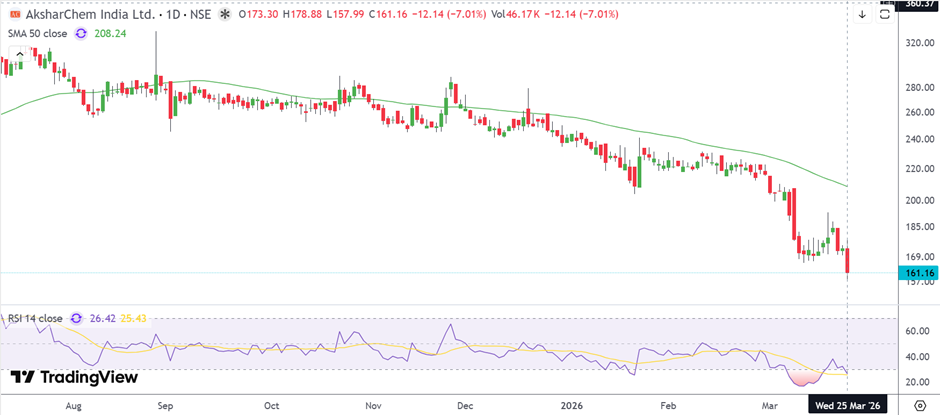
Source: TradingView
Outlook Hinges on Stabilisation Attempts
In the near term, the stock’s direction will depend on whether it can stabilize above lower support zones and show early signs of accumulation. A sustained recovery would require reclaiming levels above the ₹180 mark and eventually the 50-day moving average. However, continued earnings weakness may limit upside unless operational performance improves.
Risk Factors to Watch
- Stock remains significantly below its 50-day moving average, indicating a strong bearish trend.
- High expense base continues to pressure margins.
- Oversold conditions do not yet indicate reversal confirmation.
FAQs
Why did AksharChem shares fall today?
The stock declined around 7.01% due to continued selling pressure and weak broader trend structure.
What is the key resistance level?
Immediate resistance is placed in the ₹180–₹200 range.
Is AksharChem in a downtrend?
Yes, the stock continues to show lower highs and lower lows, indicating a sustained corrective phase.